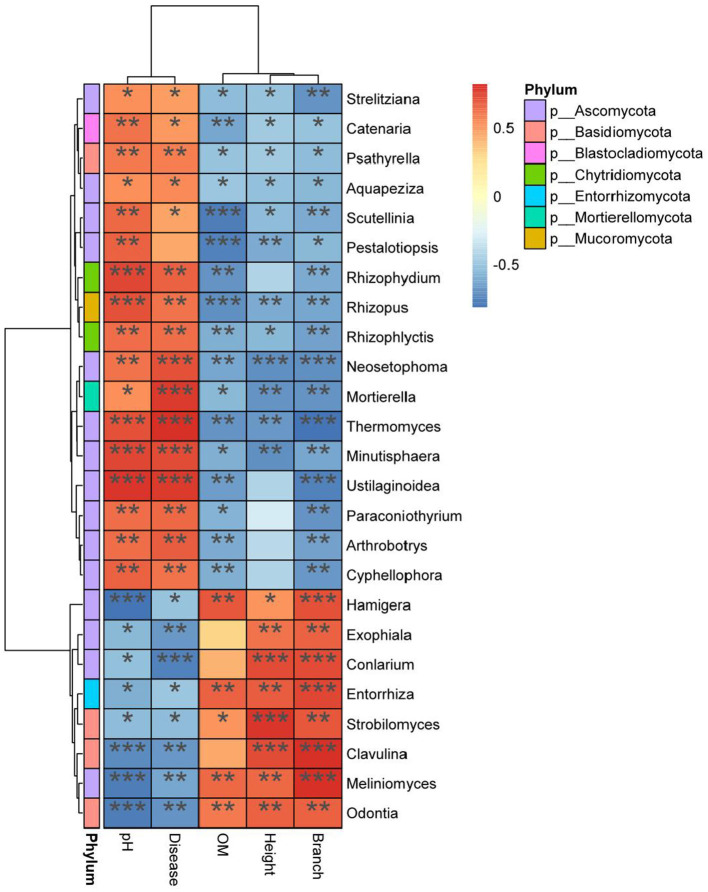
Figure 9.
Heat map analysis of correlation among indexes. X axis for environmental factors, Y axis for species. R value (rank correlation) and P value are obtained by calculation. The R value is displayed in different colors in the figure. *, **, and *** means p < 0.05, p < 0.01, and p < 0.001 respectively. The right legend is the color interval of different R values. At the same time, the color bar on the left marks the classification of the species.

