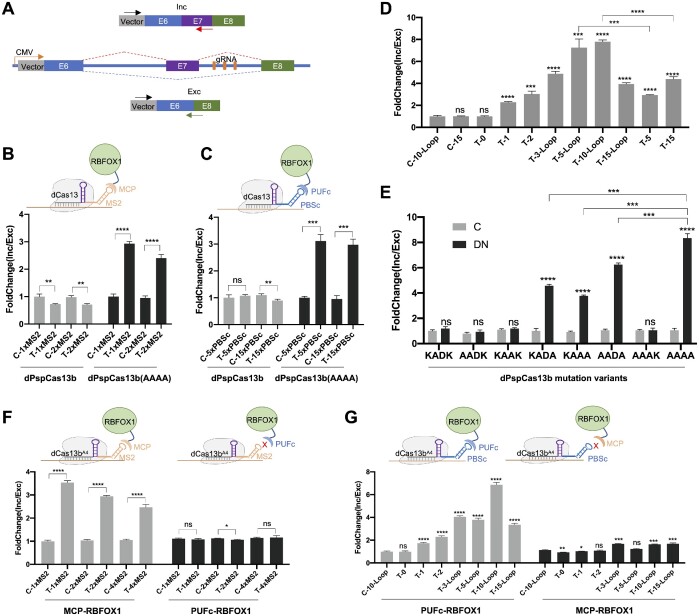
Figure 1.
CREST-mediated RNA alternative splicing modulation. (A) Schematic of pCI-SMN2 minigene reporter containing the genomic region spanning SMN2 exon 6 to exon 8 downstream of a CMV promoter. Inclusion and exclusion isoforms can be quantified with the same forward primer annealing to a constitutive region (Black arrow) and a reverse primer annealing to isoform-specific exon junctions (red arrow for the inclusion isoform and green arrow for the exclusion isoform). Three gRNAs targeting downstream intron of exon 7 are marked in orange. (B) Above: Schematic of CREST MCP-MS2 system. MS2 scaffold was tagged at the 3’ end of gRNA and MCP was fused to RBFOX1 in place of its RRM domain for induction of exon7 inclusion. Bottom: splicing readouts measured by RT-qPCR. Y axis: Exon inclusion efficiency (inclusion/exclusion ratio measured by RT-qPCR) is represented as fold change relative to non-target control gRNA. X axis: HEK293T cells were co-transfected with pCI-SMN2 reporter, different dPspCas13b mutants, MCP-RBFOX1, and gRNAs with different number of MS2 scaffold. Non-target control (C-) and minigene target-specific (T-) gRNAs are indicated. The numbers (1× or 2×) of the MS2 scaffold are indicated. Different dPspCas13b variants are indicated. dPspCas13b: deficiency at targeting transcripts cleavage. dPspCas13b(AAAA): deficiency at both targeting transcripts cleavage and gRNA processing. (C) Above: Schematic of CREST PUFc-PBSc system. PUFc binding sites (PBSc) were appended to the 3’ end of gRNA and PUFc was fused to RBFOX1 in place of its RRM domain. Bottom: splicing readout measured by RT-qPCR. 5 and 15 copies of PBSc with ‘GCC’ linker were tested. (D) Optimization of PBSc linkers. Fold change of Inclusion and Exclusion ratio was normalized by non-target control gRNA with 10 copies of PBSc with loops (C-10-Loop). ‘Loop’ stands for the high GC content stem-loop structure between PBSc and the copy numbers (0–15) of the PBSc motifs are indicated. PBSc with indicated number but without ‘Loop’ were linked by ‘GCC’. dPspCas13b(AAAA) was used in all groups. (E) Screen for the minimal set of mutations in dPspCas13b compatible with CREST. The original motif (KADK) for gRNA processing in pspCas13b was used as control and other variants were tested as indicated. Gray (C) stands for non-target control gRNA and black (DN) stands for on-target gRNA. PUFc-RBFOX1 and 10 copies of PBSc with Loop were used in all conditions. dPspCas13b with AAAA mutation are hereafter referred to as dCas13A4. (F) Test of the crosstalk between the PUFc and MS2. HEK293T cell were co-transfected with dCas13A4, pCI-SMN2 minigene, gRNA-MS2 and MCP-RBFOX1 (Gray columns on the left) or PUFc-RBFOX1(Black columns on the right) as indicated. Y axis shows the fold change of Inclusion and Exclusion ratio relative to non-target control. (G) Test of the crosstalk between the MCP and PBSc. HEK293T cell were co-transfected with dCas13A4, pCI-SMN2 minigene, gRNA-PBSc and MCP-RBFOX1 (gray columns on the left) or PUFc-RBFOX1(black columns on the right) as indicated. All data are displayed as mean ± SD, n = 3. *P< 0.05, ** P < 0.01,***P< 0.001, ****P< 0.0001, ns, not significant, by two-sided t-test.

