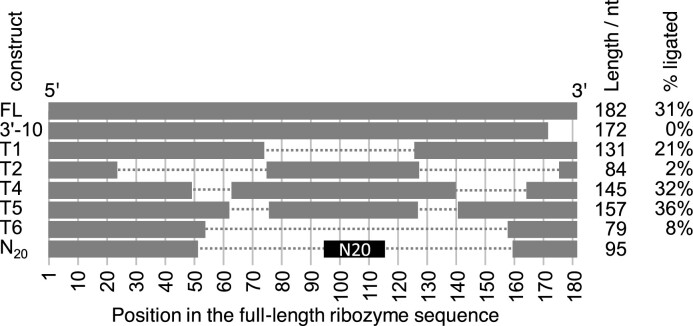
Figure 2.
Truncation analysis of the most active ribozyme clone 15. For each ribozyme construct, the name (left column), the graphical schematic of the truncation (grey bars, to scale) and the remaining length is shown, as well as the activity of each variant (right column). Only the first 3′-truncation variant is shown (3′-10) because no 3′-truncation variant showed activity. Breaks in the horizontal bars for constructs T1–T6 denote internal deletions. The replacement of sequence 53–159 with an N20 randomized sequence is annotated in black. No activity is listed for the N20 construct because this construct describes the library with many different sequences and activities.

