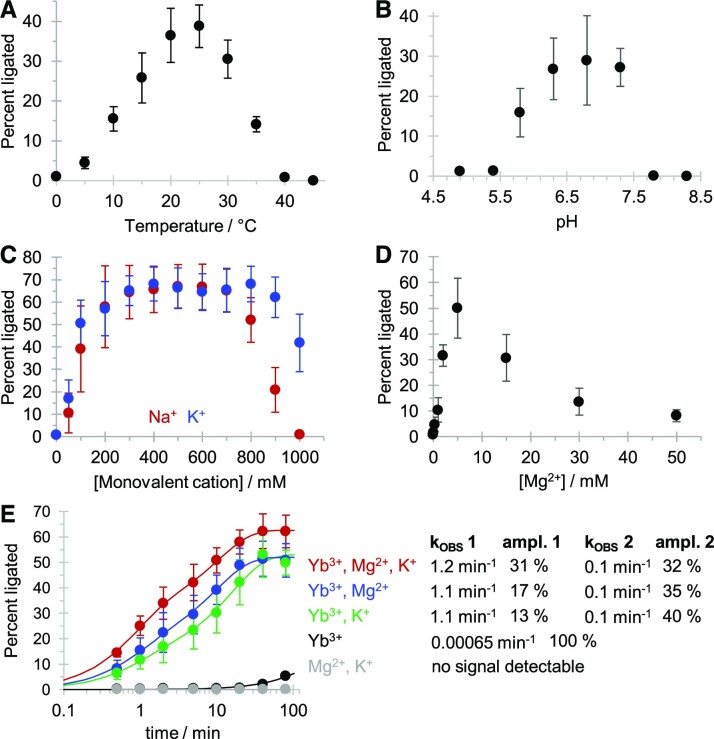
Figure 5.
Optimization of reaction temperature, pH, Na+/K+ and Mg2+ for ribozyme 51. (A) Effect of reaction temperature between 0°C and 50°C. Reactions were executed at 0.1 mM Yb3+, 1 mM cTmp, 50 mM HEPES/KOH pH 7.3, 150 mM NaCl and 20 minutes reaction time. (B) Effect of reaction pH, at pH 4.9 and 5.3 (NaOAc/HOAc), 5.8 and 6.3 (MES/NaOH), 6.8 (MOPS/NaOH), 7.3 and 7.8 (HEPES/NaOH), and 8.3 (Tris/HCl). Reactions were executed at 0.1 mM Yb3+, 1 mM cTmp, 50 mM buffer, 150 mM NaCl, 25°C, and 20 min reaction time. (C) Effect of varying concentrations of KCl (blue) or NaCl (red) added to the triphosphorylation reaction. Reactions were executed at 0.1 mM Yb3+, 1 mM cTmp, 50 mM HEPES/KOH pH 7.3, 25°C and 20 minutes reaction time. (D) Effects of varying concentrations of MgCl2 added to the triphosphorylation reaction. Reactions were executed at 0.1 mM Yb3+, 1 mM cTmp, 50 mM HEPES/KOH pH 7.3, 25°C and 20 minutes reaction time. (E) Reaction kinetics with different combinations of 500 mM KCl, 5 mM MgCl2, and 0.1 mM Yb3+, all at 1 mM cTmp, 50 mM HEPES/KOH pH 7.3, and 25°C. Colors represent reactions with Yb3+, K+, Mg2+ (red), Yb3+ and Mg2+ (blue), Yb3+ and K+(green), Yb3+ (black), and Mg2+ and K+ (grey). Curved lines represent double-exponential equations fitted to the data by least squares fitting, with the rates and amplitudes for each condition given to the right. Note that the reaction time in the graph is displayed in logarithmic order. Error bars in all panels represent standard deviations from triplicate experiments.

