Figure 3.
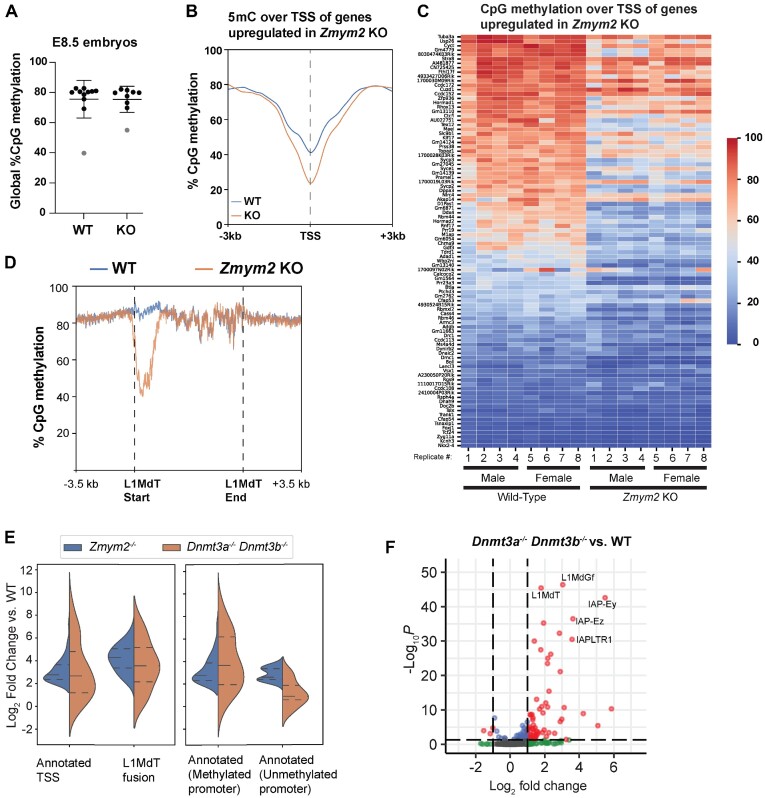
Impaired DNA methylation in Zmym2−/− over germline genes and LINE elements. (A) Swarm plot of global CpG methylation levels of individual Zmym2+/+ and Zmym2−/− E8.5 embryos. Two samples coloured gray were excluded from subsequent analysis. (B) Metaplot of CpG methylation over TSS of 95 upregulated genes in Zmym2−/− embryos expressed from annotated TSS. (C) Heatmap of DNA methylation within 500 bp of the TSS of each of upregulated gene is indicated for each E8.5 embryo. Transposon-fusion genes and the Y-chromosomal gene Uba1y are excluded. (D) Metaplot of DNA methylation over all full-length (>6 kb) L1MdT elements in the genome. (E) Expression of each gene in the given category is shown (KO/WT) in Zmym2−/− and Dnmt3a−/− Dnmt3b−/−. Note that most genes upregulated in Zmym2−/− show elevated expression in Dnmt double knockout. (F) Volcano plot of differentially expressed transposable elements comparing Dnmt3a−/− Dnmt3b−/− and control E8.5 embryos.

