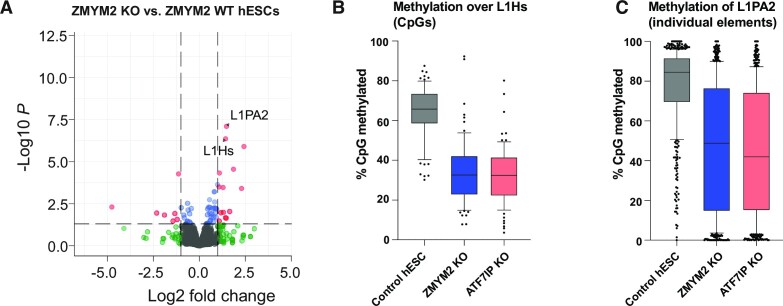
Figure 4.
Upregulation and hypomethylation of young LINE elements in ZMYM2−/− human embryonic stem cells. (A) Volcano plot of differentially expressed transposons comparing ZMYM2+/+ and ZMYM2−/− hESCs. Significant differentially expressed transposons (fold change ≥ 2, q-value < 0.05) are coloured red. (B) Boxplot of CpG methylation across 1 kb start regions of full length L1Hs transposable elements. Data was mapped to an L1Hs consensus element, and individual CpG sites are represented as dots. (C) Boxplot of average CpG methylation across L1PA2 individual transposable elements. Each element is represented as a dot.

