Figure 5.
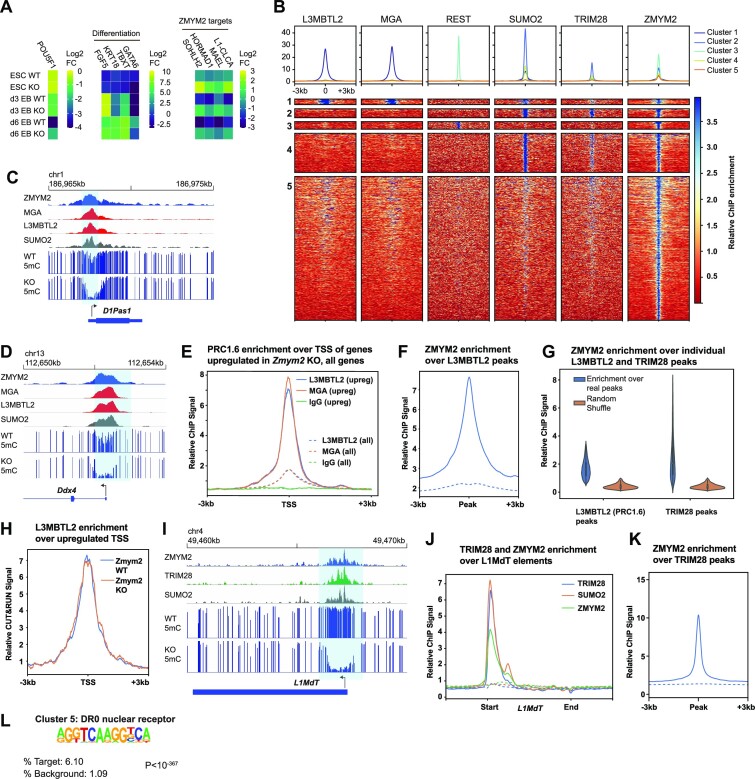
ZMYM2 silences PRC1.6 and TRIM28 targets and promotes their methylation. (A) Relative expression of the pluripotency factor Pou5f1, differentiation genes, and ZMYM2-target genes in three Zmym2−/− lines as compared with three control lines, during two separate embryoid body differentiation experiments. Average results from these n = 6 replicates total are shown. (B) Heatmaps of ZMYM2, L3MBTL2, MGA, REST, SUMO2 and TRIM28 enrichment over ZMYM2 ChIP-seq peak summits and the flanking 3 kb regions (n = 21 549 peaks). Peaks were partitioned into five clusters using a k-means algorithm. Peak numbers: Cluster 1, 290 peaks; Cluster 2, 931 peaks; Cluster 3, 796 peaks; Cluster 4, 4080 peaks; Cluster 5, 14 969 peaks. Cluster 1 peaks are shown at twice the width of other peaks to enhance visibility. (C, D) ChIP-seq and DNA methylation data over the D1Pas (C) and Ddx4 (D) loci. Note colocalization of ZMYM2 with PRC1.6 components and hypomethylation in Zmym2−/−. (E) Metaplot of L3MBTL2, MGA and IgG negative control ChIP-seq signals over the annotated transcription start site of upregulated genes in Zmym2−/− E8.5 embryos (solid lines) with transposon-fusions excluded and the annotated transcription start site of all genes (dashed lines). (F) Metaplot of ZMYM2 ChIP-seq signal over L3MBTL2 peaks. Dashed line indicates ChIP input. (G) ZMYM2 ChIP-seq enrichment over L3MBTL2 (13 936 peaks) and TRIM28 (6830 peaks) peak sets. Enrichment over random peaks of the same size is shown as a comparison. (H) Metaplot of L3MBTL2 CUT&RUN ChIP-seq signal over the annotated TSS of upregulated genes in both Zmym2+/+ and Zmym2−/− mESCs. (I) ChIP-seq and DNA methylation data over a representative LINE element. Note overlap of TRIM28 and ZMYM2 peaks and hypomethylation over the peak site. (J) Metaplot of ZMYM2, TRIM28, SUMO2 ChIP-seq over all full length L1MdT elements. Dashed line indicates ChIP input. (K) Metaplot of ZMYM2 over all uniquely mapped TRIM28 peaks. Dashed line indicates ChIP input. (L) HOMER motif analysis of Cluster 5 ZMYM2 peaks show enrichment of the DR0 nuclear receptor motif relative to random (background) signal.

