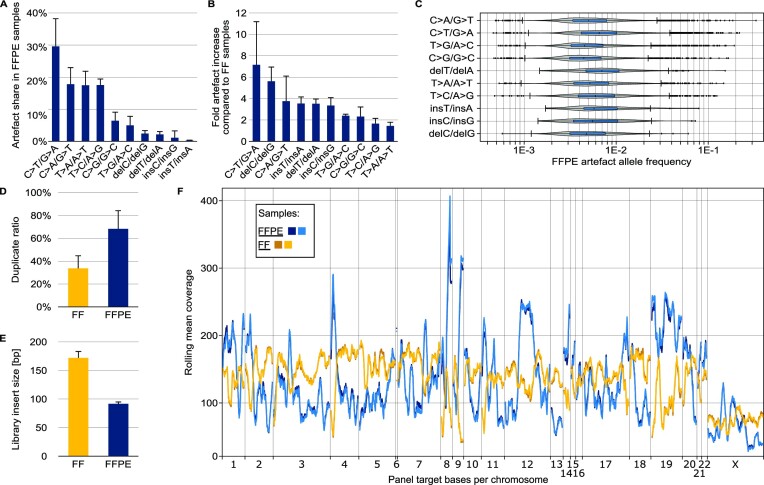
Figure 2.
Characterisation of differences in NGS of FFPE-DNA and FF-DNA. FF-DNA was taken from the same tissue sample as FFPE-DNA. Experimental details are described in the online methods section. (A) Proportion of each artefact type in a set of five different FFPE samples of varying qualities and preparation workflows. (B) Fold increase in artefact number in FFPE-DNA compared to FF-DNA sequences. FFPE and FF read files were appropriately down-sampled before comparison. (C) Allelic frequency of artefacts in a typical FFPE sample of low quality. (D) Sequence duplicate ratios for low-quality FFPE-DNA and matching FF-DNA samples. (E) Insert sizes for the sample pairs used in (D). (F) Systematic coverage bias typical for targeted sequencing of FFPE samples. The plot shows the rolling mean coverage over the target region of a hybridisation capture bait panel. The reads were randomly down-sampled so that the mean unique coverage over the target bases was identical in all four libraries.

