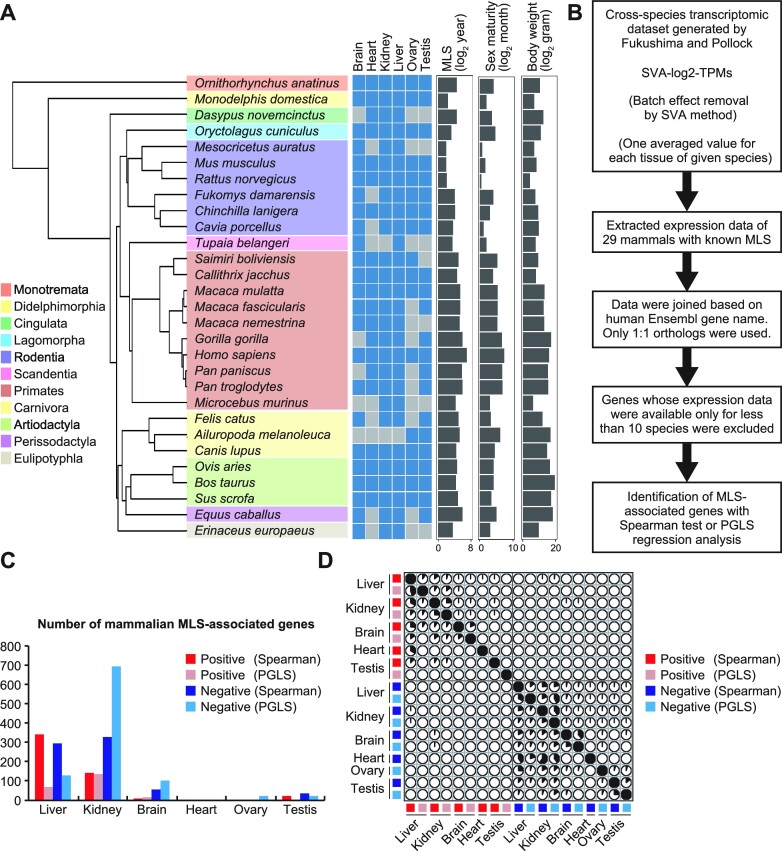
Figure 1.
Identification of mammalian MLS-associated genes. (A) The names of 29 mammalian species that were used to extract mammalian MLS-associated genes and a phylogenetic tree drawn by R package ‘ape’ using phylogenetic data downloaded from VertLife.org. A heatmap shows the availability of transcriptomic data and each box is colored blue if transcriptomic data was available in the corresponding tissue of corresponding species. Right bar graphs show MLS, age of female sexual maturity, and body weight of each species. (B) Procedures for the identification of mammalian MLS-associated genes. (C) The bar graph shows the number of MLS-associated genes identified in this study. (D) The correlation plot represents the overlap among mammalian MLS-associated genes identified in liver, kidney, brain, heart, ovary and testis by Spearman and PGLS methods. Each pie represents the percentage of overlapping genes in the gene set shown on the left side.

