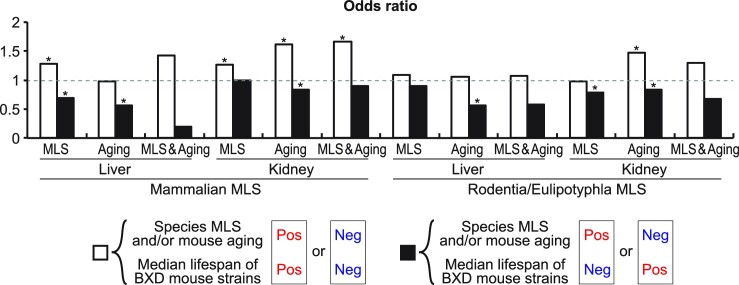
Figure 5.
Gene expression patterns associated with species MLS and/or mouse aging exhibit significant similarities to those associated with the lifespan of genetically heterogeneous mouse strains. The white bars indicated as ‘MLS’ show the odds ratios of genes positively correlated with both mouse lifespan and species MLS, and genes negatively correlated with both mouse lifespan and species MLS. The white bars indicated as ‘Aging’ show the odds ratios of genes positively correlated with both mouse lifespan and mouse aging, and genes negatively correlated with both mouse lifespan and mouse aging. The white bars indicated as ‘MLS & Aging’ show the odds ratios of genes positively correlated with all mouse lifespan, species MLS, and mouse aging, and genes negatively correlated with all mouse lifespan, species MLS, and mouse aging. The black bars indicated as ‘MLS’ show the odds ratio of genes positively correlated with mouse lifespan and simultaneously negatively correlated with MLS, and genes negatively correlated with mouse lifespan and simultaneously positively correlated with MLS. The black bars indicated as ‘Aging’ show the odds ratio of genes positively correlated with mouse lifespan and simultaneously negatively correlated with mouse aging, and genes negatively correlated with mouse lifespan and simultaneously positively correlated with mouse aging. The black bars indicated as ‘MLS & Aging’ show the odds ratios of genes positively correlated with mouse lifespan and simultaneously negatively correlated with both species MLS and mouse aging, and genes negatively correlated with mouse lifespan and simultaneously positively correlated with both species MLS and mouse aging. * FDR < 0.05 (binominal test).

