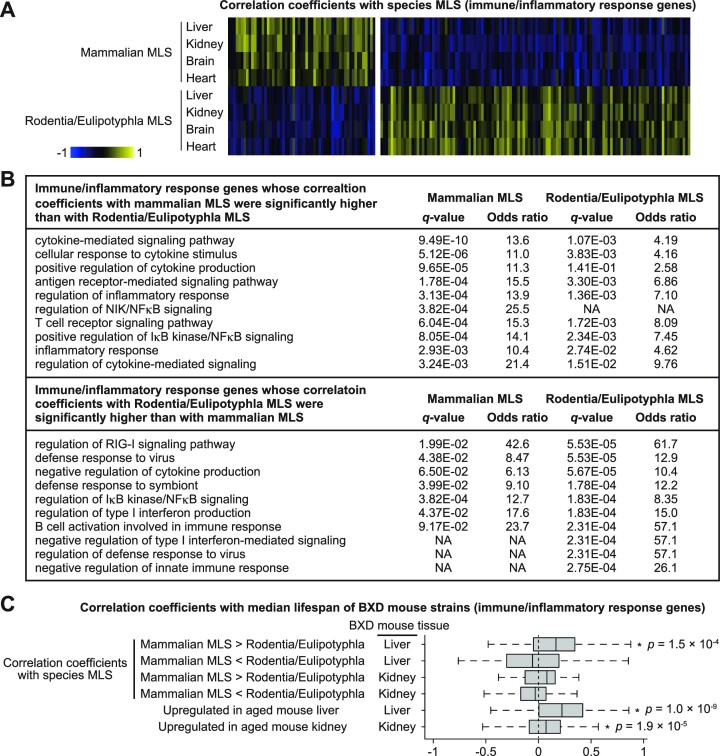
Figure 6.
Immune/inflammatory response genes are differentially associated with MLS of Rodentia/Eulipotyphla and those of a wider range of mammals. (A) The heatmaps show the Spearman coefficients of correlation between species MLS and gene expressions. Each column represents a Spearman coefficient of single gene. Only immune/inflammatory genes (GO:0006945 and GO:0006955) whose Spearman coefficients were significantly different (two-tailed t test, FDR < 0.1) between tissues of Rodentia/Eulipotyphla and those of a wider range of mammals are shown in the figure. (B) The top 10 enriched GO biological process terms of the genes shown in (A). (C) The boxplots show the coefficients of correlation between median lifespan of BXD mouse strains and gene expression. Only immune/inflammatory genes (GO:0006945 and GO:0006955) that were upregulated during aging in mouse liver or kidney, or those whose Spearman coefficients were significantly different (two-tailed t test, FDR < 0.1) between tissues of Rodentia/Eulipotyphla and those of a wider range of mammals are shown in the figure. * P-value < 0.05 (one-sample Wilcoxon test).

