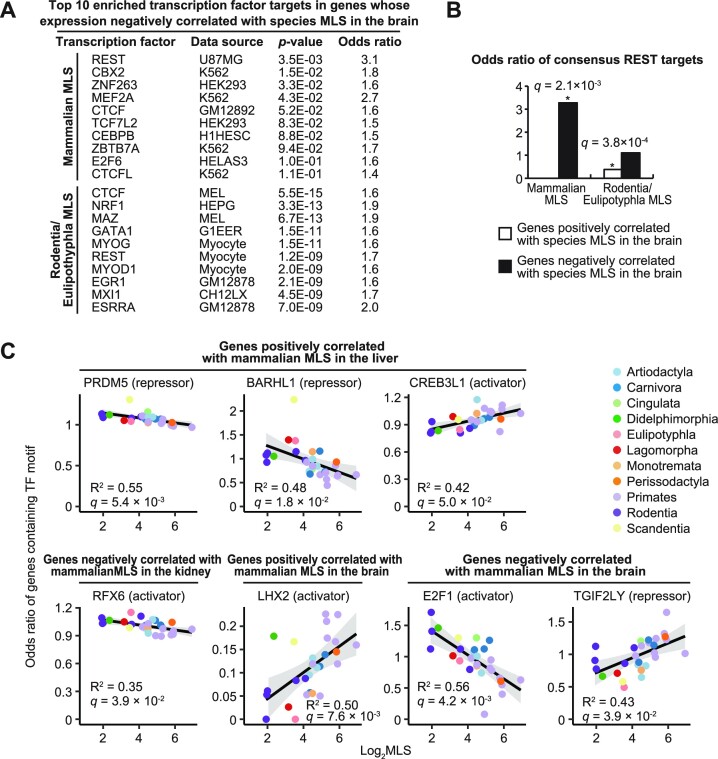
Figure 7.
TFs regulating MLS-associated genes expression and their evolutionary changes. (A) Top 10 transcription factor targets that were overrepresented in the genes whose expression in the brain negatively correlated with species MLS. (B) The bar graph shows the odds ratios of consensus REST target genes in the genes whose expression in the brain correlated with species MLS. (C) The plots show the odds ratio of genes containing at least one motif of the indicated TFs in their 1000 bp promoter regions. * FDR < 0.05 [Fisher's exact test for (A, B), and Spearman correlation test for (C)].

