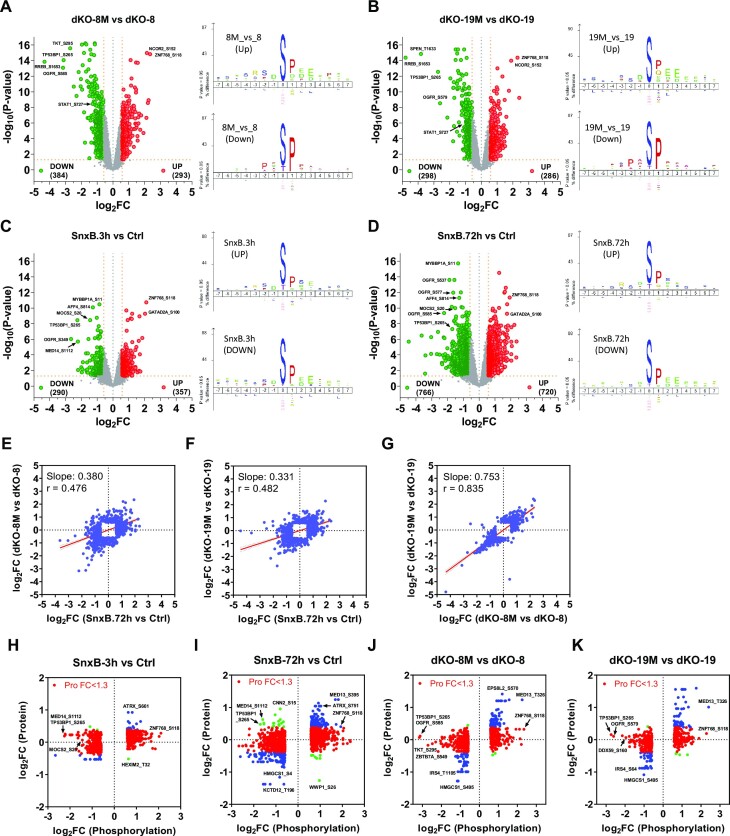
Figure 10.
Phosphoproteomic analysis of the effects of CDK8 and CDK19 kinase inhibition. Tandem Mass Tag (TMT) based phosphoproteomic analysis was carried out for the effects of CDK8 and CDK19 kinase inhibition across the same three TMT-11plex batches as in Figure 9. (A–D) Volcano plots of phosphoepitope changes (left) and results of motif enrichment analysis (right) for the comparisons of dKO-8M versus dKO-8 (A), dKO-19M versus dKO-19 (B), 3-h Senexin B treatment versus control (C), and 72-h Senexin B treatment versus control (D). (E) Comparison of the effects of CDK8 kinase domain mutation and 72-h Senexin B treatment on protein phosphorylation. (F) Comparison of the effects of CDK19 kinase domain mutation and 72-h Senexin B treatment on protein phosphorylation. (G) Comparison of the effects of CDK8 and CDK19 kinase domain mutations on protein phosphorylation. (H–K) Comparisons of fold changes in the protein levels to changes in phosphorylation for differentially expressed phosphoepitopes after 3-h (H) or 72-h Senexin B treatment (I), in cells expressing kinase-inactive CDK8 mutant versus WT CDK8 (J) or kinase-inactive CDK19 mutant versus WT CDK19 (K). Red dots: phosphoproteins affected with FC < 1.3 at the protein level. Blue dots: phosphoproteins affected with FC ≥ 1.3 at the protein level in the same direction as phosphoprotein changes. Green dots: phosphoproteins affected with FC ≥ 1.3 at the protein level in the opposite direction to phosphoprotein changes (H–K).

