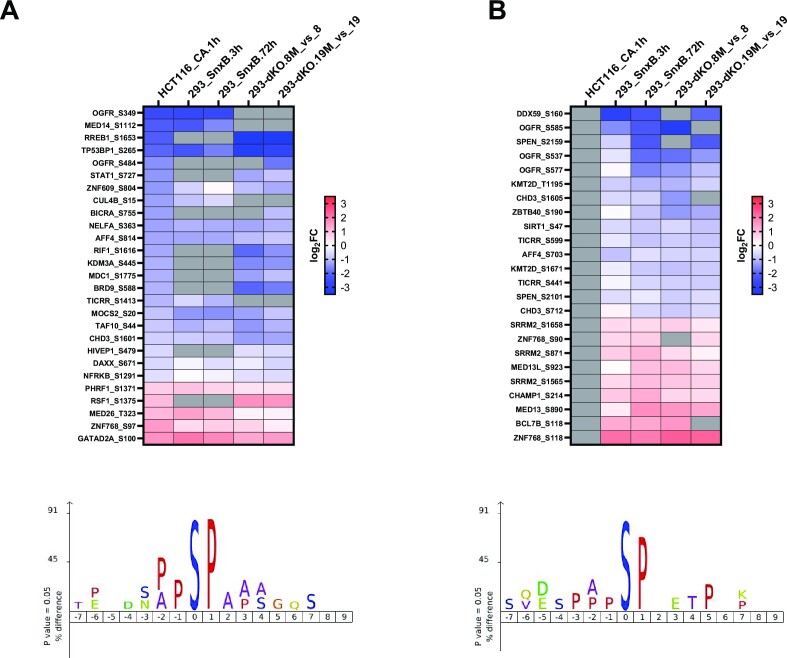
Figure 11.
Comparative phosphoproteomics analysis of the effects of Mediator kinase inhibition in 293 and HCT116 cells. (A) Heatmap of the 27 phosphoepitopes similarly affected by Mediator kinase inhibition in HCT116 (48) and 293 cells (this study). (B) Heatmap of 24 representative phosphoepitopes (discovered in at least three comparisons in 293 cells) that were not identified in HCT116 study (48). Enriched motif analysis of the downregulated phosphoepitopes is presented below the heatmaps.

