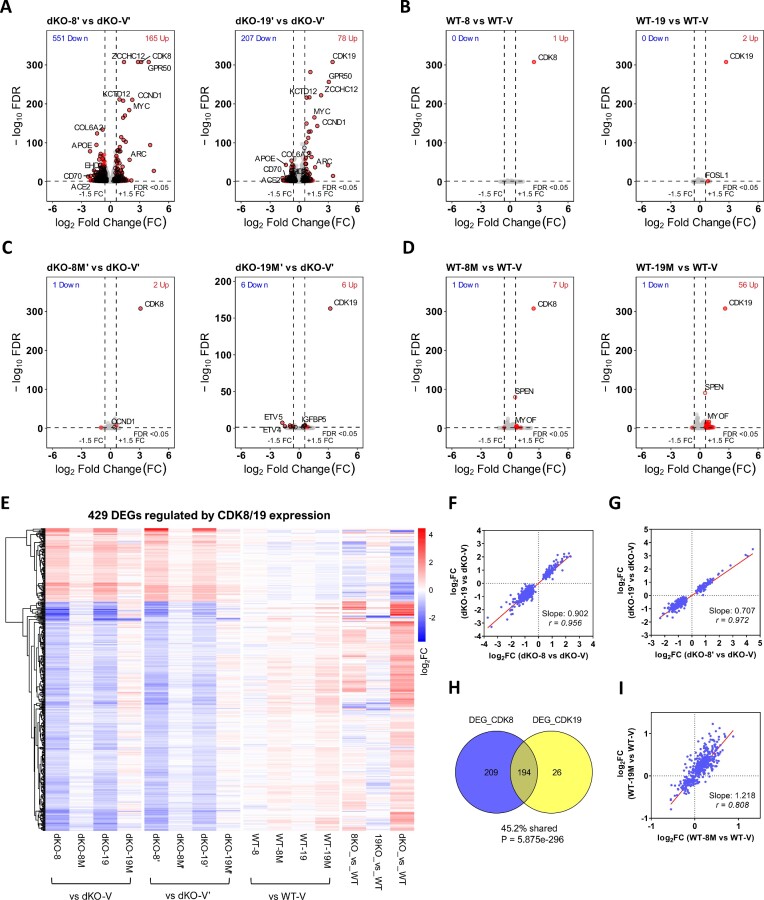
Figure 2.
RNA-Seq analysis of the effects of CDK8 and CDK19 knockout and re-expression on gene expression. (A) Volcano plots of comparisons of gene expression between 293 dKO cells reconstituted with WT CDK8 or CDK19 relative to the corresponding vector-transduced dKO controls. Red dots: DEGs passing the selection criteria (FC > 1.5; FDR < 0.05). Black circles: high-confidence DEGs that pass the selection criteria (average FC > 1.5; FDR < 0.05 in both series of reconstitution derivatives, see Supplementary Figure S1A). (B) Volcano plots of comparisons of gene expression between parental 293 (WT) cells overexpressing wild-type CDK8 or CDK19 relative to the corresponding vector-transduced WT controls. (C, D) Volcano plots of comparisons of gene expression between 293 dKO (C) or WT cells (D) expressing kinase-inactive CDK8 (8M) or CDK19 (19M) mutants relative to the corresponding vector-transduced controls. (E) Heatmap of 429 high-confidence DEGs regulated by CDK8/19 reconstitution in dKO cells in 293 derivatives (hierarchical clustering). (F, G) Comparison of the effects of CDK8 versus CDK19 reconstitution in dKO cells on the high-confidence CDK8/19-regulated DEGs in two different series of reconstitution derivatives. (H) Overlap of DEGs affected by CDK8 or CDK19 reconstitution in dKO cells; P-value determined by hypergeometric test. (I) Comparison of the effects of kinase-inactive CDK8 versus kinase-inactive CDK19 expression in parental cells on the high-confidence CDK8/19-regulated DEGs. Slope and Pearson correlation coefficients (r) were calculated by linear regression and correlation analysis.

