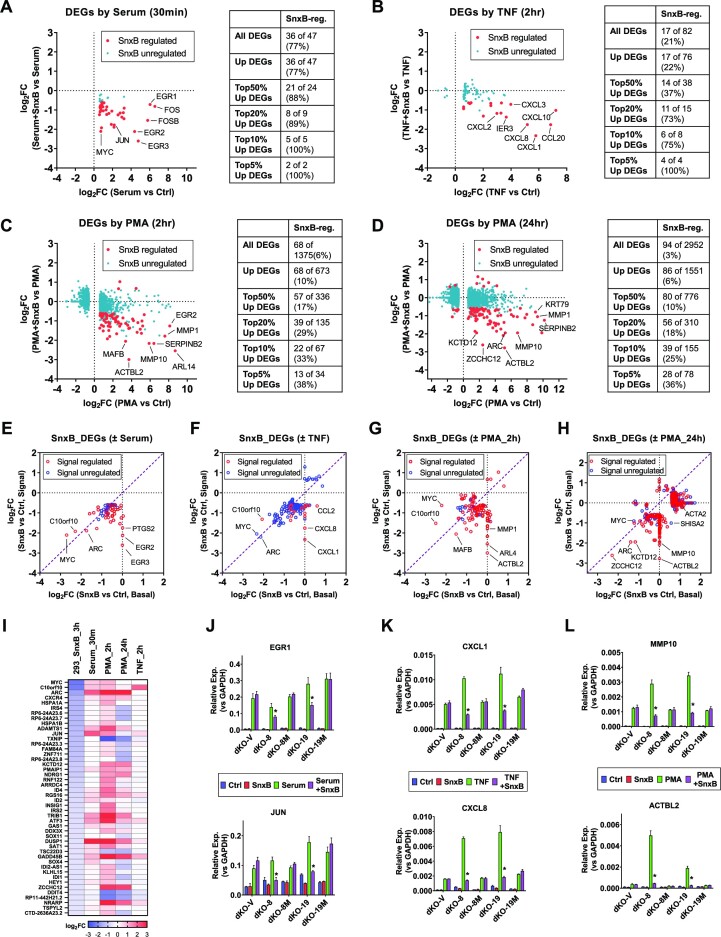
Figure 5.
Transcriptomic analysis of the effects of Mediator kinases on signal-regulated gene expression. (A–D) RNA-Seq analysis of 293 cells treated with the indicated signals in the presence or in the absence of 1 μM Senexin B (SnxB), added 1 h before signal stimulation and maintained till the end of experiment. (A) Cells were serum starved for 48 h and then treated with serum (FBS added to 10% final concentration) for 30 min. (B–D) Cells were treated with TNF (10 ng/ml) for 2 h (B) or PMA (30 nM) for 2 h (C) or 24 h (D). The dot plots show the effects of Senexin B treatment on the signal-affected DEGs (FC > 1.5; FDR < 0.05). Red dots: Senexin B-affected DEGs. Blue dots: Senexin B-unaffected DEGs. The tables on the right show the number and percentage of signal-regulated DEGs affected by Senexin B treatment. (E–H) Comparison of effects of Senexin B on the expression of genes regulated by Senexin B either under basal conditions or upon signal stimulation. Red circles: signal-regulated genes. Blue circles: genes that are not regulated by signals. (I) Effects of different signals on the expression of 46 DEGs regulated by Senexin B at 3 h time point under basal conditions. (J–L) qPCR analysis of mRNA expression of the indicated genes in dKO derivatives with or without signal or Senexin B: serum stimulation (J), TNF (K), PMA (24 h) (L). Data are presented as mean ± SEM (n = 3). Asterisks: P < 0.01 (two-way ANOVA, Tukey's multiple comparisons test) for the differences between Senexin B-treated and untreated conditions.

