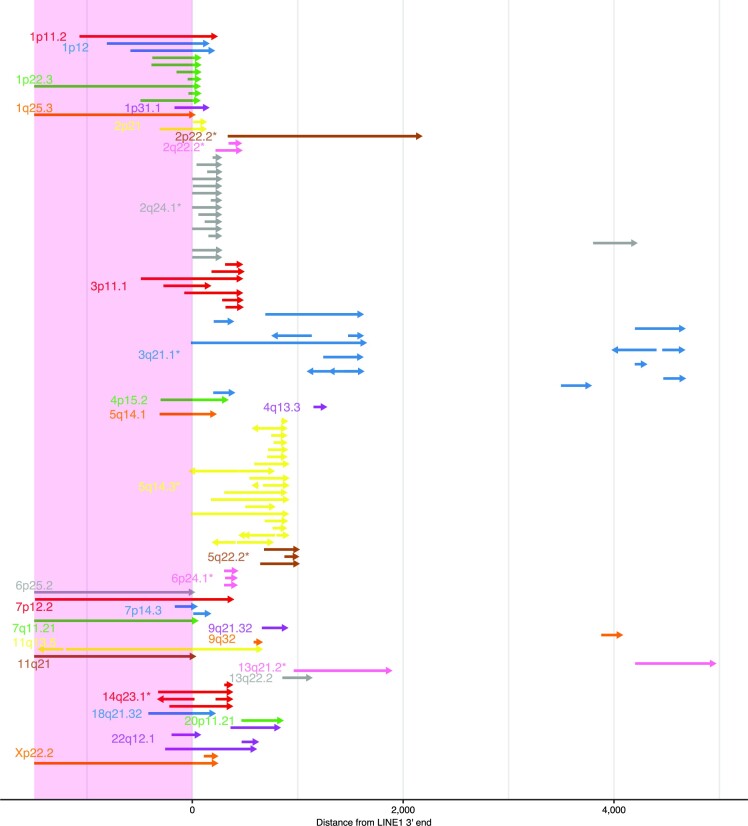
Figure 5.
A comprehensive picture of L1 transductions identified in H2009. Horizontal arrows in each vertical position show distinct LINE1 transduction events whose corresponding LINE1 source sites are distinguished by color and labeled by cytoband. Asterisks beside the labels indicate that the source sites are not in the human reference genome. Arrows starting before the position of LINE1 3′ ends (within LINE1 sequences shaded by light pink) are partnered transductions, whereas those starting after LINE1 3′ ends are orphan transductions. Multiple arrows in one line indicate some structural changes in the inserted sequences (most typically internal inversions depicted by two outwardly directed arrows) .

