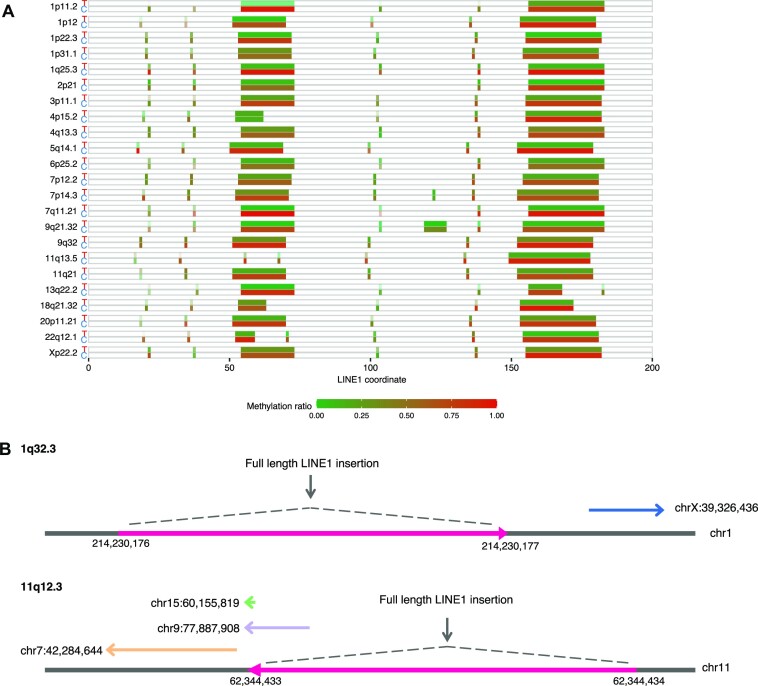
Figure 6.
Characterization of L1 transductions identified in H2009. (A) Methylation status of promoters of somatic LINE1 source elements for H2009. For each LINE1 source site (labeled by cytoband), the upper and lower boxes represent the tumor (T) and matched control (C) methylation states. After the detection of methylated bases for each CpG site using nanopolish, the ratios of methylations were calculated. Contrasting density was determined by the depth of sequence covering each site. P-values measuring the significance of methylation frequency difference between the tumor and match control at each source element ranged from  to
to  with a median of
  (see Materials and Method for detail). (B) Examples of nested LINE1 insertion identified in H2009. Two full-length LINE1 insertion sites became the new active sources of LINE1 transductions. The novel source site at 1q32.3 generated one orphan LINE1 transduction. The second novel source site at 11q12.3 eventually produced two partnered transductions and one orphan transduction.

