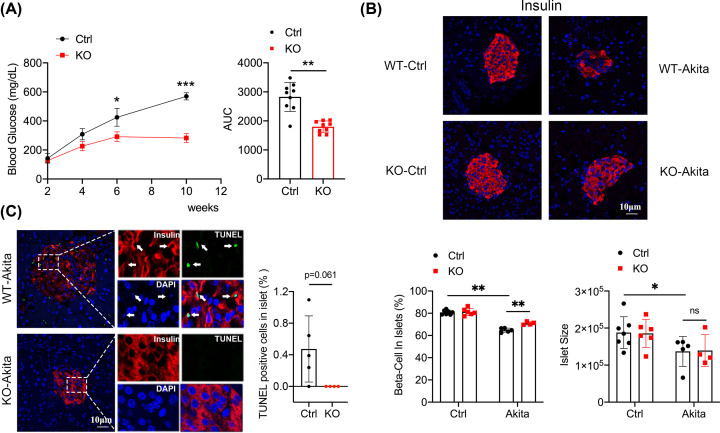
Figure 2. Characterization of Mpv17 wild-type and mutant mice carrying Ins2Akita mutation.
(A) The time course of blood glucose levels in the mice and AUC comparison. Ctrl: wild-type control (n=9), KO: Mpv17 mutant (n=9). *P<0.05, **P<0.0001, ***P<0.000001, statistically significant. (B) Fluorescence staining of insulin in the mice as indicated, and quantifications of β-cell number and islet size of the mice. WT-vehicle (n=7), wild-type-Akita (n=5), KO-vehicle (n=6), KO-Akita (n=4). *P<0.05, **P<0.01, statistically significant. (C) TUNEL assay and insulin staining showing apoptosis in β-cells of the WT-Akita and Mpv17 KO-Akita mice in panel (B). Quantification of the results is showed on the right; *P=0.061. All the results are presented with mean ± SD. The comparisons between two groups were performed using two-tailed, unpaired Student’s t-test (A,C), and the multiple comparison tests between groups were performed using two-way ANOVA followed by Bonferroni’s post-hoc test (B).

