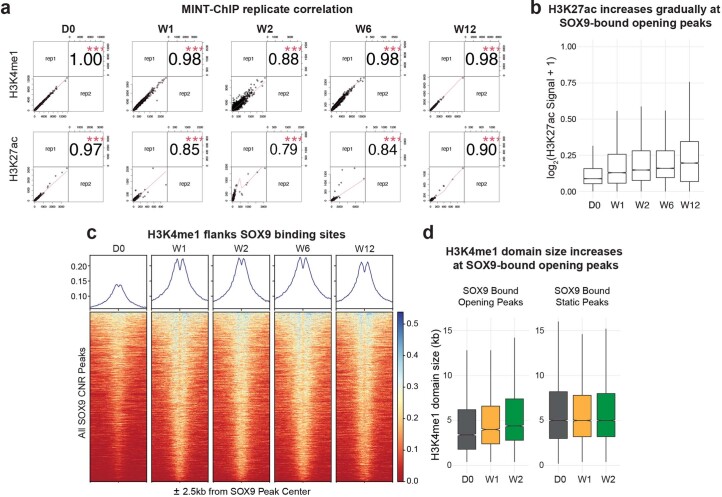
Extended Data Fig. 4. MINT-ChIP experiments and analyses of H3K4me1 relative to SOX9 binding.
a, Replicate correlation analyses of the H3K4me1 and H3K27ac MINT-ChIP show strong correlation between each duplicate sample across all time points. b, Boxplot of H3K27ac signals at opening SOX9 peaks overtime. Note that the signal increases gradually from W1 to W12. n = 2 biological replicates. Boxplot is centered at median and bound by 1st and the 3rd quartile, and whiskers extend to 1.5 times IQR on both ends. c, Profile plot (top) and heatmap (bottom) showing the H3K4me1 signals at all SOX9 Cut-and-Run peaks across time points. Note the strong flanking pattern of the H3K4me1 signals adjacent to each SOX9 binding site (center dip) from W1 to W12. d, Boxplot of H3K4me1 domain sizes at opening SOX9 peaks and SOX9 bound static peaks shows gradual increase of H3K4me1 domain size from W1 to W2 after SOX9 induction. n = 2 biological replicates. Boxplots are centered at median and bound by 1st and the 3rd quartile, and whiskers extend to 1.5 times IQR on both ends.

