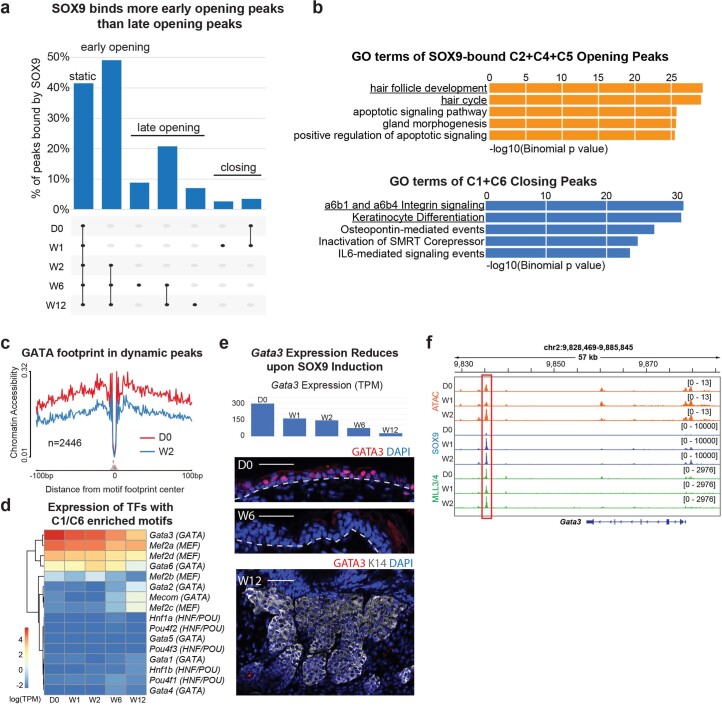
Extended Data Fig. 6. Epidermal TFs diminish rapidly upon SOX9 induction in EpdSCs.
a, Upset plot shows % of peaks bound by SOX9 in the top peak sets from Fig. 2d. Note that peaks opened by W2 are more often bound by SOX9 than later opening or closing peaks. b, GO terms enriched in SOX9-bound opening peaks (C2, C4, C5) and all closing peaks (C1,C6). c, ATAC footprint analysis at D0 and W2 shows a decrease in chromatin accessibility at GATA footprint in dynamic ATAC peaks following SOX9 induction. d, EpdSCs expression of TFs that belong to TF families whose motifs are enriched in closing ATAC peaks (C1 and C6 in Fig. 3c) (binomial is used to calculate the significance). e, (top) Transcript levels of Gata3 over time following SOX9 induction. (bottom) GATA3 immunofluorescence of epidermis at D0, W6 and W12. Scale bars, 50μm. f, Integrative Genomics Viewer (IGV) snapshot of SOX9, ATAC and H3K4me1 tracks within the Gata3 locus. The red box indicates a peak >30kb downstream from the gene that is bound by SOX9 and MLL3/4, and stays open at W2 even though the gene body of Gata3 closes its chromatin (see Fig. 5b).

