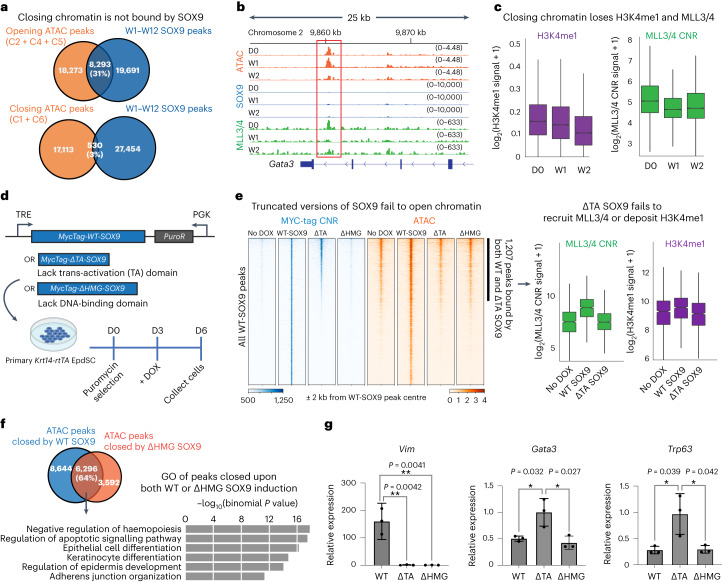
Fig. 5. SOX9 achieves EpdSC fate silencing independent from DNA binding.
a, Top: Venn diagram shows robust overlap between opening peak clusters (C2 + C4 + C5) and SOX9 peaks. Bottom: Venn diagram shows only 3% overlap between closing peaks (C1 + C6) and SOX9 peaks. b, ATAC, SOX9 CNR and MLL3/4 CNR tracks at the Gata3 locus, showing that, by W1 after SOX9 induction, MLL3/4 CNR peaks were diminished, and by W2, ATAC peaks closed, even though CNR showed no SOX9 binding in this region (red box). c, Box plots showing loss of MLL3/4 and H3K4me1 signal beginning at W1 post SOX9-induction and specifically at ATAC peaks that close by W2 (C1, C6). n = 2 biological replicates. d, Schematic of inducing of MYC-tagged wild-type (WT) or mutant versions of SOX9 in transduced Krt14-rtTA cultured EpdSCs. e, Profile plot and heat map showing MYC-tagged wild-type or variant SOX9 binding (blue) and accessibility (orange) before and after DOX. Peaks are sorted the same way across samples. Note that ΔHMG-SOX9 fails to bind DNA, and ΔTA-SOX9 binds only to the subset of SOX9 peaks that were already accessible before DOX. Both mutants of SOX9 failed to open chromatin de novo. Right: box plot comparing MLL3/4 CNR and H3K4me1 signals at the peaks that are bound by wild-type SOX9 and ΔTA-SOX9. Note that only wild-type SOX9 brought additional MLL3/4 and deposited more H3K4me1 to these peaks. n = 2 biological replicates. f, Venn diagram shows overlap between the ATAC peaks that are closed by wild-type SOX9 or ΔHMG-SOX9 induction. GO terms reveal that epidermal enhancers close upon wild-type or ΔHMG-SOX9 induction (binomial is used to calculate the significance). g, Quantitative PCR analysis of genes that are directly induced (Vim) or indirectly repressed (Gata3 and Trp63) by SOX9 in EpdSC cells. All the error bars are mean ± s.d. *P < 0.05 and **P < 0.01, two-tailed t-test. n = 3 biological replicates. All box plots are centred at median and bound by the first and third quartile, and whiskers extend to 1.5 times interquartile range (IQR) on both ends.

