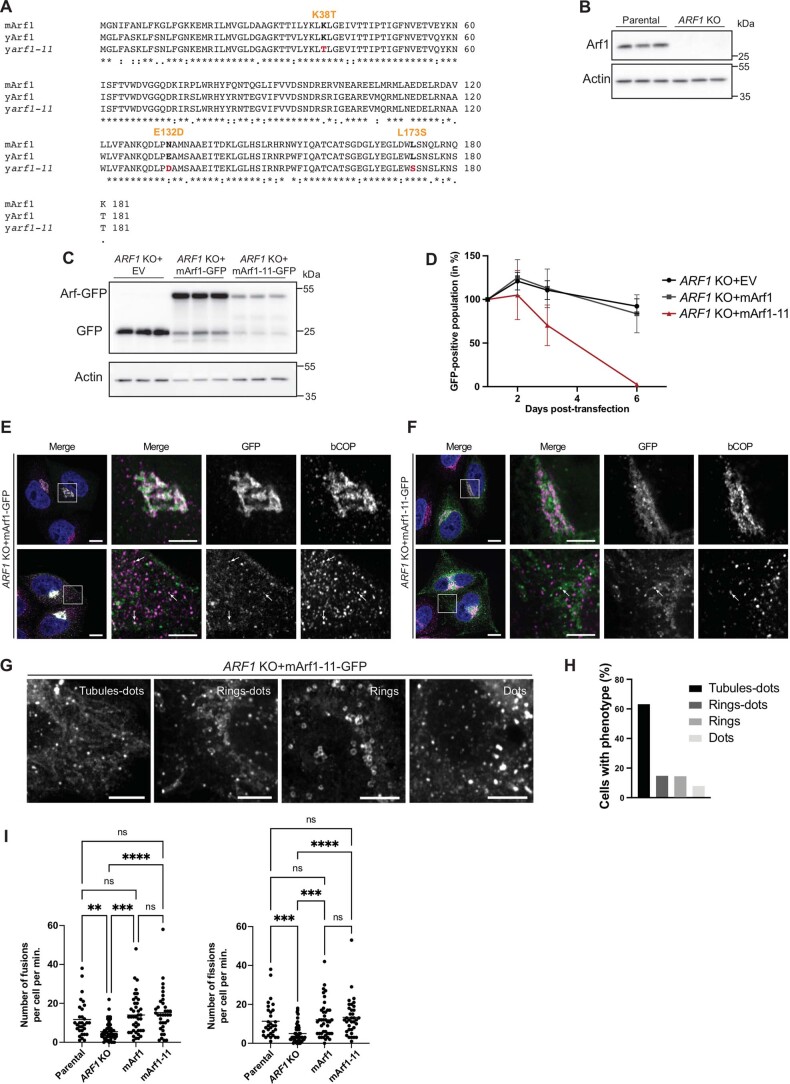
Extended Data Fig. 3. Functional conservation of Arf1-11 in mammalian cells.
(A) Alignment of mammalian Arf1 (mArf1), yeast Arf1 (yArf1) and the yeast arf1-11 (yArf1-11) amino acids sequences. Arf1-11 mutation’s and their corresponding amino acids in mArf1 are shown. (B) Immunoblot analysis of Arf1 presence in parental HeLa cells and the CRISPR-Cas9 ARF1 KO cells. For each cell line, three independent biological replicates were analyzed on the same gel. (C) Immunoblot analysis of Arf1-GFP presence in ARF1 KO HeLa cells transfected either with an empty vector (EV), with mArf1-GFP or with mArf-11-GFP. For each cell line, three independent biological replicates were analyzed on the same gel. Actin was used as internal control. (D) Cell viability assay as percent of GFP-positive cells in the total population after transfection of EV, mArf1-GFP or mArf-11-GFP. Mean and standard deviation are shown from n = 3 biological replicates. (E, F) Co-localization of mArf1- (E) and mArf1-11-GFP (F) expressed in the ARF1 KO cell line with COPI vesicles done by immunostaining against the coatomer subunit beta (bCOP). Squares show magnification of a perinuclear and distal portion of the cell. Scale bars: 10 µm and 5 µm (inlays). Images were acquired 24 h after transfection. (G) Different localizations of mArf1-11 observed in ARF1 KO HeLa cell line expressing mArf1-11-GFP. (H) From the images in (G), four phenotypes were identified and their occurrences quantified. 380 cells were quantified. (I) Mitochondrial fusion and fission events measured in Parental cell lines, ARF1 KO, ARF1 KO expressing mArf1- or mArf1-11-GFP. Events were scored 48 h after transfection. Mean and standard deviation are shown, Parental = 31 cells, ARF1 KO = 53 cells, ARF1 KO+mArf1 = 41 cells, ARF1 KO+mArf1-11 = 38 cells from n = 3 biological replicates; Statistical analysis were done using a two-way ANOVA test with Turkey’s multiple comparison test, ****p = 0.000000000048; ***p = 0.001; **p = 0.0047. Source numerical data and unprocessed blots are available in source data. See also Supplementary data 1.

