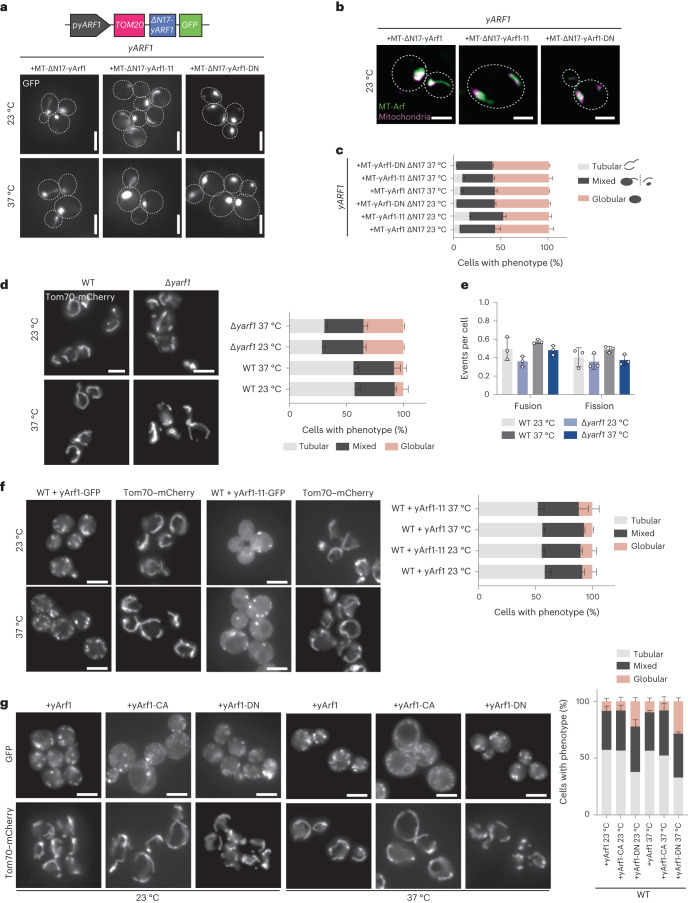
Fig. 2. Control of Arf1 activity is needed for mitochondria dynamics.
a, Schematic of the construct designed to anchor yArf1 on mitochondria (MT) via Tom20. yARF1 deleted in its myristoylation sequence (∆N17) was expressed from its endogenous promoter and fused to GFP on its 3′ end. Localization of MT-anchored ∆N17-yArf1–GFP, the dominant negative yArf1-DN or yArf1 bearing yArf1-11–GFP variant in yARF1 cells grown at 23 °C or shifted to 37 °C. Scale bar, 5 µm. b, High-resolution co-localization of MT-anchored ∆N17-yArf1–GFP, yArf1-DN and Arf1-11–GFP with mitochondria stained with MitoTracker Deep Red FM. A single focal plane of 0.2 µm is shown. Scale bar, 2 µm. c, Measurements of mitochondria phenotypes (tubular, mixed or globular) based on images taken in a. Mean and standard deviation are shown; ∆yarf1 + MT-Arf1 23 °C = 419 cells, ∆yarf1 + MT-Arf1-11 23 °C = 544 cells, ∆yarf1 + MT-Arf1-DN 23 °C = 606 cells, ∆yarf1 + MT-Arf1 37 °C = 509 cells, ∆yarf1 + MT-Arf1-11 37 °C = 453 cells, ∆yarf1 + MT-Arf1-DN 37 °C = 462 cells from n = 3 biological replicates. d, Mitochondria morphology were imaged in WT and ∆yarf1 strains grown at 23 °C or shifted to 37 °C using Tom70–mCherry as mitochondrial marker. Mitochondria phenotypes (tubular, mixed or globular) were measured. Mean and standard deviation are shown; WT 23 °C = 355 cells, WT 37 °C = 582 cells, ∆yarf1 23 °C = 419 cells, ∆yarf1-11 23 °C = 571 cells from n = 3 biological replicates. Scale bar, 5 µm. e, Mitochondrial fusion and fission events were measured on the basis of Supplementary Videos 5–8. Mean and standard deviation are shown; WT 23 °C = 320 cells, WT 37 °C = 279 cells, ∆yarf1 23 °C = 319 cells, ∆yarf1-11 37 °C = 321 cells from n = 3 biological replicates. f, Mitochondria morphology were imaged in WT cells expressing yArf1–GFP or yArf1-11–GFP grown at 23 °C or shifted to 37 °C using Tom70–mCherry as mitochondrial marker. For each strain the tubular, mixed and globular phenotypes were measured. Mean and standard deviation are shown. Scale bar, 5 µm. +yArf1 23 °C = 251 cells, +yArf1 37 °C = 273 cells, +yArf1-11 23 °C = 266 cells, +yArf1-11 37 °C = 273 cells from n = 3 biological replicates. g, Mitochondria morphology were imaged in WT cells expressing yArf1-, the constitutively active mutant yArf1-CA- or the dominant negative yArf1-DN–GFP grown at 23 °C or shifted to 37 °C using Tom70–mCherry as mitochondrial marker. For each strain the tubular, mixed and globular phenotypes were measured. Mean and standard deviation are shown. +yArf1 23 °C = 269 cells, +yArf1 37 °C = 275 cells, +yArf1-CA 23 °C = 268 cells, +yArf1-CA 37 °C = 287 cells, +yArf1-DN 23 °C = 243 cells, +yArf1-DN 37 °C = 411 cells from n = 3 biological replicates. Scale bar, 5 µm. Source numerical data are available in source data.

