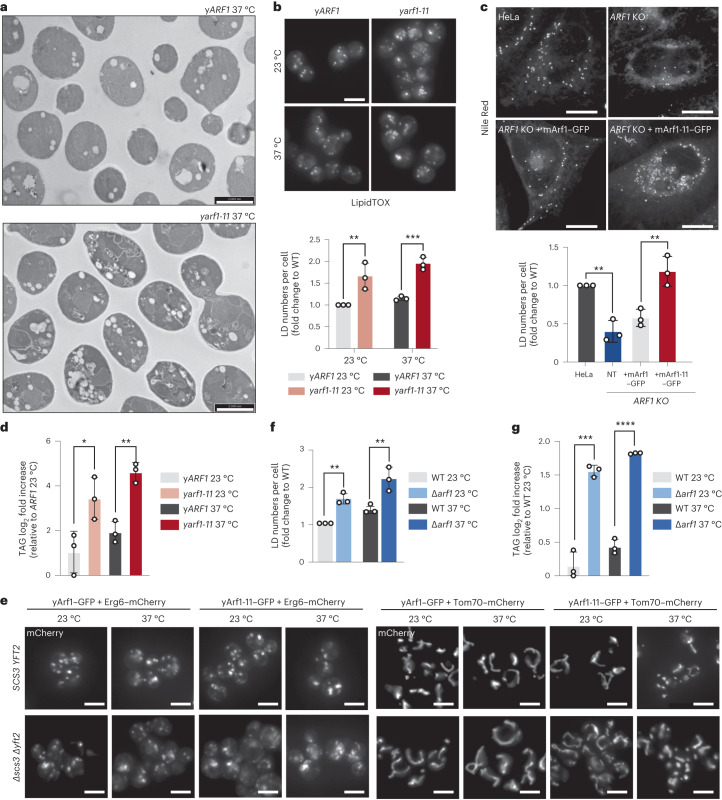
Fig. 6. Hyperactive Arf1 induces TAG accumulation.
a, TEM of yARF1 and yarf1-11 strains grown at 37 °C for 30 min. Scale bars, 2,000 nm. b, LipidTox staining of LDs in yARF1 and yarf1-11 strains grown at 23 °C or shifted to 37 °C. Scale bar, 5 µm. Mean and standard deviation are shown; yARF1 23 °C = 408 cells, yARF1 37 °C = 408 cells, yarf1-11 23 °C = 421 cells, yarf1-11 37 °C = 422 cells from n = 3 biological replicates; two-way ANOVA using Sidak’s multiple comparison, ***P = 0.0009, **P = 0.0032. c, Nile Red staining of LDs in parental HeLa cells (control), ARF1 KO HeLa cells, and ARF1 KO HeLa cells expressing mArf1 or mArf1-11. For each cell line, the numbers of LD were quantified. Images were acquired 24 h after transfection. Mean and standard deviation are shown; HeLa control = 182 cells, ARF1 KO = 181 cells, ARF1 KO +mArf1 = 163 cells, ARF1 KO +mArf1-11 = 151 cells from n = 3 biological replicates; unpaired two-tailed t-test, **P = 0.0096. Scale bar, 5 µm. d, Measurements of TAG in the yARF1 and yarf1-11 strains grown at 23 °C or shifted to 37 °C. Mean and standard deviation are shown from n = 3 biological replicates; unpaired two-tailed t-test, *P = 0.0349; **P = 0.002. e, LDs (Erg6) and mitochondria (Tom70) morphologies imaged in the yARF1 and yarf1-11 parental strains and in strains deprived of SCS3 and YFT2 (∆scs3 ∆yft2) grown at 23 °C or shifted to 37 °C. f, LipidTox staining of LDs in WT and ∆arf1 strains grown at 23 °C or shifted to 37 °C. Mean and standard deviation are shown; WT 23 °C = 669 cells, WT 37 °C = 662, ∆arf1 23 °C = 673 cells, ∆arf1 37 °C = 659 cells from n = 3 biological replicates Two-way ANOVA using Sidak’s multiple comparison, WT versus ∆arf1 23 °C **P = 0.0032, WT versus ∆arf1 37 °C **P = 0.001. g, Measurements of TAG in the WT and ∆yarf1 strains grown at 23 °C or shifted to 37 °C. Mean and standard deviation are shown from n = 3 biological replicates; unpaired two-tailed t-test, ***P = 0.0002; ****P = 0.00000396. Source numerical data are available in source data. See also Extended Data Fig. 4.

