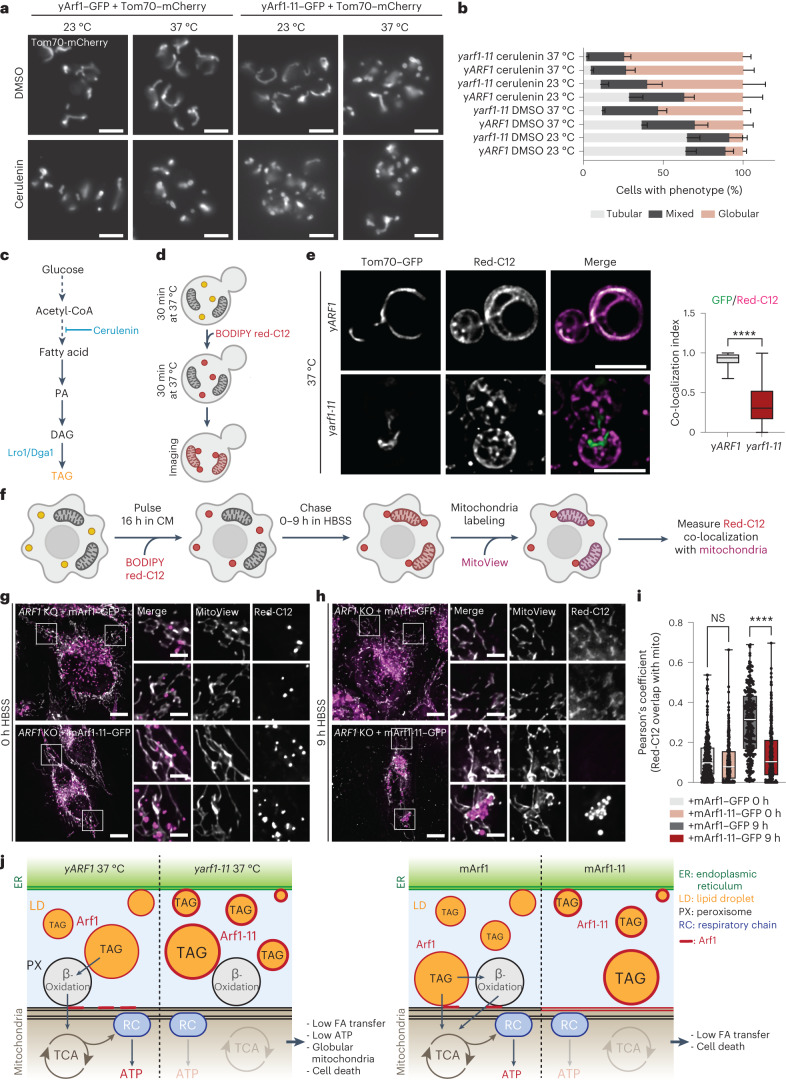
Fig. 8. Acetyl-CoA transfer loss leads to mitochondria fragmentation.
a, Mitochondrial morphology imaged in the yARF1 and yarf1-11 strains grown at 23 °C or shifted to 37 °C and treated with either DMSO or the FA synthesis inhibitor cerulenin. Scale bars, 5 µm. b, Quantification of the mitochondrial phenotypes observed in a. Mean and standard deviation are shown; yARF1 + DMSO 23 °C = 751 cells, yARF1 + DMSO 37 °C = 935 cells, yARF1 + cerulenin 23 °C = 501 cells, yARF1 + cerulenin 37 °C = 654 cells, yarf1-11 + DMSO 23 °C = 616 cells, y arf1-11 + DMSO 37 °C = 740 cells, y arf1-11 + cerulenin 23 °C = 471 cells, y arf1-11 + cerulenin 37 °C = 667 cells from at least n = 3 biological replicates. c, Metabolic pathway leading to TAG synthesis. FAs are used to produce phosphatidic acid (PA), which can be further converted to diacylglycerol (DAG) and to TAG inside LDs by the Lro1 and Dga1 enzymes. The FA synthesis inhibitor cerulenin inhibits TAG synthesis. d, Schematic of the experiment done in e. Yeast cells are first grown for 30 min at 37 °C, treated with BODIPY Red-C12 for another 30 min at 37 °C, washed and imaged. e, Acetyl-CoA transfer to mitochondria monitored in the yeast ARF1 and arf1-11 strains grown at 37 °C using the fluorescent FA BODIPY Red-C12. Co-localization of GFP signal (mitochondria) over Red-C12 one was measured using Mander’s co-localization index. Mean and minimum to maximum are shown, box ranges from the first (Q1–25th percentiles) to the third quartile (Q3–75th percentiles) of the distribution; yARF1 37 °C = 115 cells, yarf1-11 37 °C = 123 cells from n = 3 biological replicates; Unpaired two-tailed t-test, ****P = 0.000000000000001. f, Schematic representation of the FA pulse-chase assay. Cells were stained with BODIPY Red-C12 for 16 h in CM, washed and chased for 9 h in nutrient-depleted medium (HBSS). Then before imaging, cells were stained for 30 min with the MitoView dye. g,h, ARF1 KO cells expressing mArf1–GFP or mArf1-11–GFP were pulsed with BODIPY Red-C12 for 16 h, incubated 1 h in CM, transferred in HBSS (0 h; g) and chased HBSS for 9 h (h). BODIPY Red-C12 was initiated 24 h after mArf1 or mArf1-11 transfection. Scale bar, 10 µm. Scale bar inlays, 2 µm. i, Relative BODIPY Red-C12 localization measured by Pearson’s co-localization index. Mean and minimum to maximum are shown, box ranges from the first (Q1–25th percentiles) to the third quartile (Q3–75th percentiles) of the distribution; ARF1 KO + mArf1 0 h = 114 cells, ARF1 KO + mArf1-11 0 h = 122 cells, ARF1 KO + mArf1 9 h = 145 cells, ARF1 KO + mArf1-11 9 h = 153 cells from n = 3 biological replicates; two-way ANOVA using Sidak’s multiple comparison test, ****P = 0.000000000000001. NS, not significant. j, Schematic of the model we propose for Arf1 role in FA metabolization and how this affects maintenance of mitochondria morphology. For more details, see Discussion. Source numerical data are available in source data. See also Extended Data Figs. 6–10.

