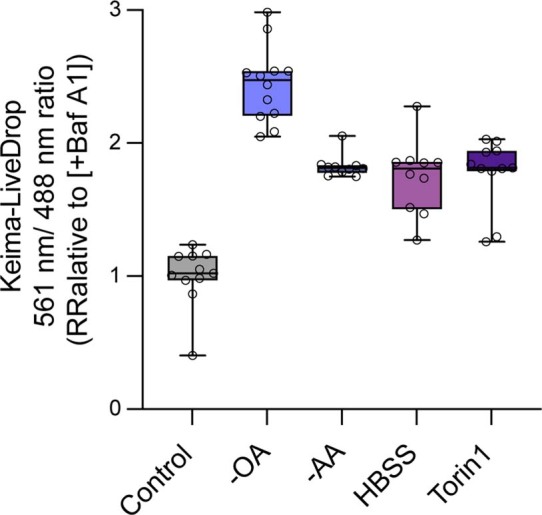
Extended Data Fig. 6. Activation of spartin-mediated lipophagy in different metabolic perturbations.

Ratiometric fluorescence measurement of Keima–spartin in SUM159 wild-type cell in various conditions annotated below the graph. Cells were treated with 0.5 mM OA for 24 h and chased for 4 h after OA withdrawal together with metabolic perturbations (100 nM Baf A1 treatment, amino acid depletion, HBSS, or 250 nM Torin 1 addition). Median ± the 25th to 75th percentiles, the whiskers extended to the minima and the maxima, n = 11 cells (Baf A1), 12 cells (OA withdrawal), 10 cells (AA depletion), 10 cells (HHBS), and 11 cells (Torin1) from two independent experiments. Source numerical data are available in source data.
