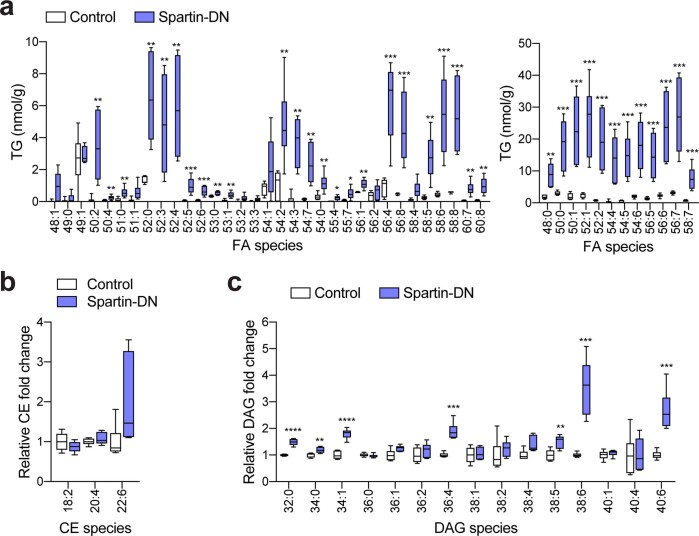
Extended Data Fig. 10. Major lipid class changes in the spartin-DN-infected M1 cortices.
a−c, Lipidomic profiles of the AAV-infected M1 cortices. Lipids were extracted from tissues using an MTBE method and analyzed by LC-MS/MS positive ion mode. Absolute amounts of detected TG species, normalized by tissue weight (a). Relative fold changes of CE (b) and DAG (c) lipid classes. Box-and-whisker plot, Median ± the 25th to 75th percentiles, the whiskers extended to the minima and the maxima, n = 6 mice, **p < 0.01, ***p < 0.001, ****p < 0.0001 (a, 58:7 = 0.000754, 56:7 = 0.000393, 56:6 = 0.000444, 56:5 = 0.000738, 54:6 = 0.000463, 54:5 = 0.000426, 54:4 = 0.000849, 52:2 = 0.000516, 52:1 = 0.000452, 50:1 = 0.000688, 50:0 = 0.000782, 48:0 = 0.001107, 60:8 = 0.001432, 60:7 = 0.001566, 58:8 = 0.000339, 58:6 = 0.00057, 58:5 = 0.001099, 56:8 = 0.000765, 56:4 = 0.00035, 56:1 = 0.001576, 55:7 = 0.012073, 55:4 = 0.011659, 54:0 = 0.00632, 54:7 = 0.00109, 54:3 = 0.000166, 54:2 = 0.004482, 53:1 = 0.00169, 53:0 = 0.002413, 52:6 = 0.00086, 52:5 = 0.000911, 52:4 = 0.000621, 52:3 = 0.002428, 52:0 = 0.000684, 51:0 = 0.008827, 50:4 = 0.008494, 50:2 = 0.002913; c, 40:6 = 0.000276, 38:6 = 0.000118, 38:5 = 0.003104, 36:4 = 0.000045, 34:1 = 0.00001, 34:0 = 0.006981, 32:0 = 0.000003), Two-tailed unpaired t-test on each row, multiple comparisons test using the two-stage step-up method of Benjamini, Krieger and Yekutieli. Source numerical data are available in source data.

