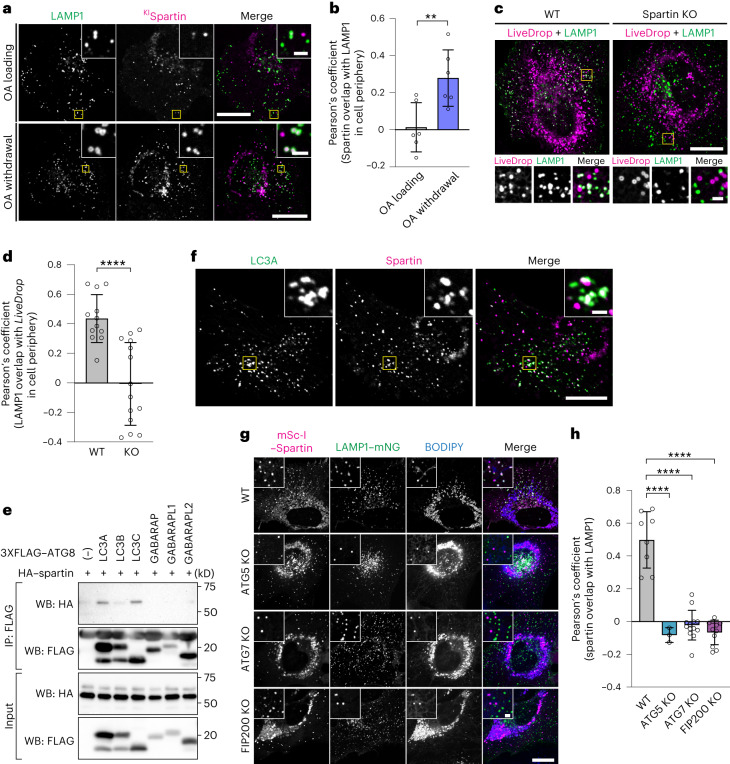
Fig. 2. Spartin mediates autophagy-dependent LD delivery to lysosomes.
a, Cells expressing endogenously tagged spartin (with mScarlet-I) and transiently expressing LAMP1–mNG reveal spartin and LAMP1 co-localization after oleate withdrawal. SUM159 cells treated with 0.5 mM OA for 24 h (top) and chased for 3 h after OA withdrawal (bottom). Scale bars: full-size, 20 μm; insets, 2 μm. b, Overlap of spartin and LAMP1 in cell periphery with or without OA withdrawal for 2 h after 18 h OA addition as shown in a (Pearson’s coefficient analysis). Mean ± s.d., n = 6 fields of view, three independent experiments, **P = 0.0091, two-tailed unpaired t-test. c, WT or spartin KO cells transiently co-expressing HaloTag–LiveDrop (pre-labelled with 100 nM JF549) and LAMP1–mNG reveal spartin deficiency impairs LD targeting to lysosomes. Cells treated with 0.5 mM OA (24 h) and chased for 3 h after OA withdrawal. Scale bars as in a. d, Overlap of LiveDrop and LAMP1 in cell periphery shown in c quantified by Pearson’s coefficient analysis. Mean ± s.d., n = 12 cells (WT) and 14 cells (KO) from three independent experiments, ****P < 0.001, two-tailed unpaired t-test. e, Spartin interacts with LC3A and LC3C. HEK293T cells transiently co-expressing HA-spartin together with 3xFLAG–ATG8 (LC3A, LC3B, LC3C, GABARAP, GABARAPL1 or GABARAPL2) were subjected to immunoprecipitation with anti-FLAG antibody and analysed by immunoblot with anti-HA and anti-FLAG antibodies. f, Spartin co-localizes with LC3A. Cells expressing mScarlet-I–spartin full-length and HaloTag–LC3A (pre-labelled with 100 nM JF646) were treated with 0.5 mM OA for 24 h and chased for 3 h after OA withdrawal. Scale bars: full-size, 20 μm; insets, 2 μm. g, Delivery of spartin-coated LDs to lysosomes is autophagy-dependent. Co-localization analyses between transiently overexpressed mScarlet-I–spartin and LAMP1–mNG in SUM159 cells lacking ATG5, ATG7 or FIP200. Scale bars: full-size, 20 μm; insets, 2 μm. h, Overlap of spartin and LAMP1 in cell periphery shown in g (Pearson’s coefficient analysis). Mean ± s.d., n = 6 cells (WT), 11 cells (FIP200 KO), 13 cells (ATG7 KO) and 3 cells (ATG5 KO) cells from three independent experiments, ****P < 0.001, one-way analysis of variance, Dunnett’s multiple comparisons test. Source numerical data and unprocessed blots are available in source data.

