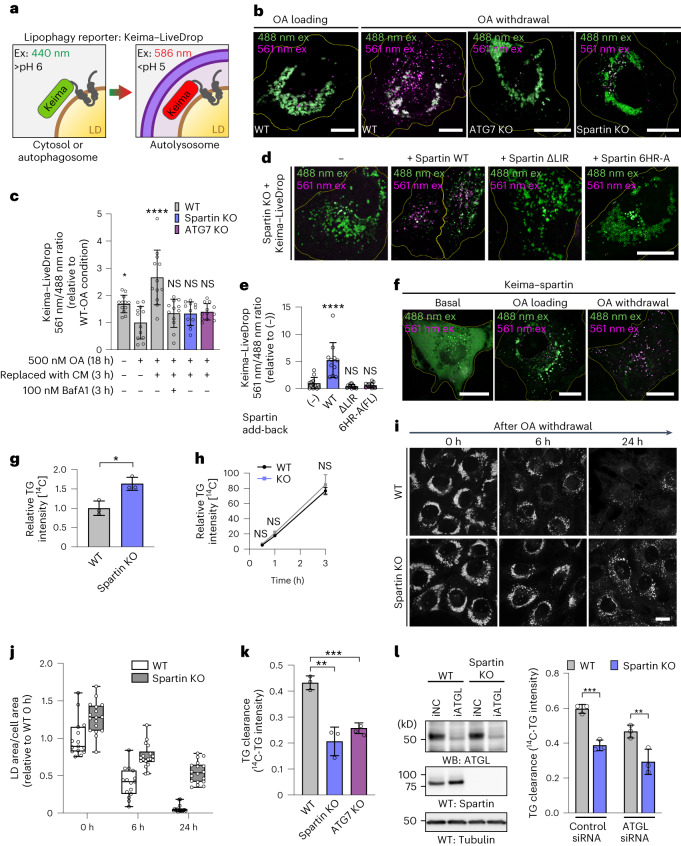
Fig. 4. Spartin deficiency causes defects in TG and LD turnover in cells.
a, Schematic illustration for Keima–LiveDrop showing excitation spectrum conversion of Keima in various conditions. b, Overlay images of Keima–LiveDrop, expressed in SUM159 WT, ATG7 KO and spartin KO cells. Scale bars, 10 μm. c. Ratiometric fluorescence measurements of Keima–LiveDrop in SUM159 WT, ATG7 KO and spartin KO in various conditions. Mean ± s.d., n = 12 cells from three independent experiments, *P = 0.0223; ****P < 0.0001, one-way analysis of variance (ANOVA), Dunnett’s multiple comparisons test. d, Overlay images of Keima–LiveDrop expressed in spartin KO, transiently transfected with Halo–spartin constructs as described. Scale bars, 20 μm. e, Ratiometric fluorescence measurements of Keima–LiveDrop in spartin KO with transient expression of Halo–spartin constructs. ****P < 0.0001. one-way ANOVA, Dunnett’s multiple comparisons test. Mean ± s.d., n = (left to right) 12, 11, 12 and 11 cells, three independent experiments. f, Overlay images of Keima–spartin expressed in WT cells. g,h, WT and spartin KO SUM159 cells pulse-labelled with [14C]-OA; incorporation into TG was measured after 0.5 mM OA treatment for 24 h (g), 0.5–3 h (h). Values calculated relative to WT (d) and spartin KO cells’ highest value at 3 h. Mean ± s.d., n = 3 independent experiments, *P = 0.0121; NS, not significant; two-tailed unpaired t-test (d) and two-way ANOVA with repeated measurements (e). i, Confocal imaging showing LDs (BODIPY493/503) in WT or spartin KO cells reveals impaired LD turnover. Cells were treated with 0.5 mM OA for 24 h and chased for 6 or 24 h after OA withdrawal. Scale bar, 20 μm. j, Area of LDs stained by BODIPY493/503 quantified from images shown in g. Median ± the 25th to 75th percentiles, the whiskers extended to the minima and the maxima, n = 15 cells (WT; 0 h, 6 h and 24 h), 17 cells (spartin KO; 0 h), 18 cells (spartin KO; 6 h, 24 h), three independent experiments. k, Reduced TG degradation in spartin KO cells. WT, spartin KO or ATG7 KO SUM159 cells pulse-labelled with [14C]-OA, and incorporation into TG measured after treatment with 0.5 mM OA for 24 h and subsequent 3 h OA withdrawal. l, Reduced TG clearance is independent of ATGL. ATGL knockdown in WT and spartin KO cells for 48 h before [14C]-OA labelling is shown in the left panel. Mean ± SD, n = 3 independent experiments, **P = 0.0022 and ***P = 0.0006, one-way ANOVA, Dunnett’s multiple comparisons test. Source numerical data and unprocessed blots are available in source data. Excitation (ex); emission (em); complete medium (CM).

