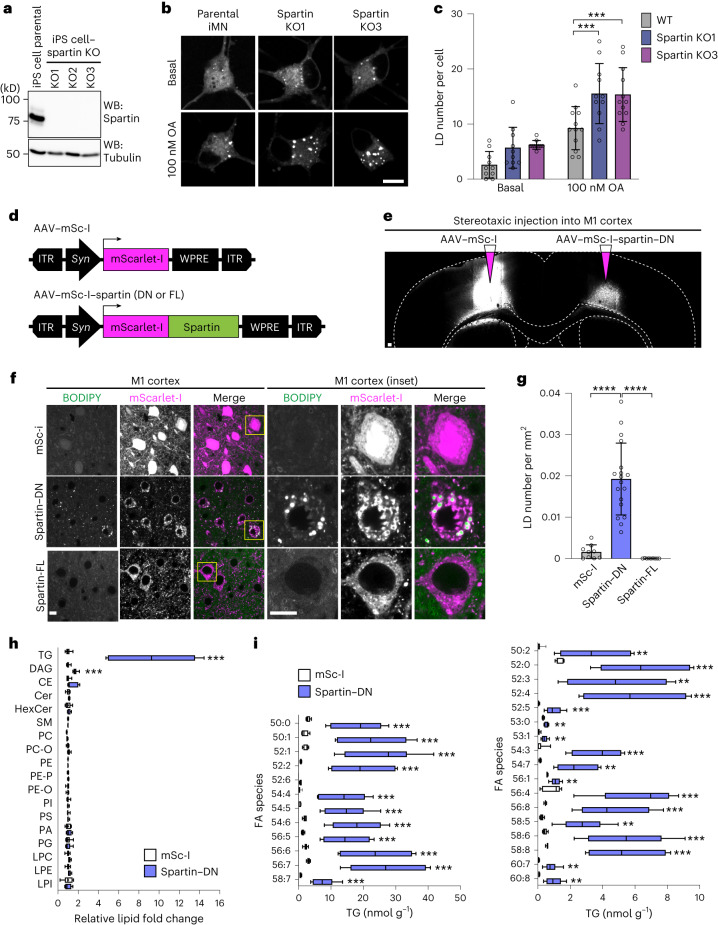
Fig. 5. Interfering with spartin function leads to TG and LD accumulation in cultured human neurons or murine brain neurons.
a, Generation of spartin KO–iPS cell lines. b, Confocal imaging of fixed iMNs showing LD accumulation in spartin KO–iMN compared with parental cell line (day 12 post-differentiation). Cells were incubated with 100 nM OA for 24 h. Scale bar, 10 μm. c, Quantification of b. Mean ± s.d., n = 10 cells (Basal; WT, Spartin KO1, Spartin KO2), 12 cells (100 nM; WT and Spartin KO2) and 11 cells (100 nM Spartin KO1), three independent experiments, ***P = 0.006 (for comparison of WT and Spartin KO1); ***P = 0.007 (for comparison of WT and Spartin KO1), one-way analysis of variance, Dunnett’s multiple comparisons test. d, AAV constructs to express mScarlet-I or mScarlet-I–spartin FL as controls or a dominant-negative form of spartin (spartin-DN) under a pan-neuronal synapsin promoter (Syn). e, Expression of mScarlet-I and mScarlet-I-fused spartin-DN in the mouse motor cortex. AAV–mSc-I or AAV–mSc-I–spartin-DN was stereotaxically injected into different hemispheres of the M1 motor cortex in 7–8-week-old WT mice. Scale bar, 100 μm. f,g, Accumulation of BODIPY493/503 in spartin-DN-expressing neurons of the mouse M1 motor cortex. Representative images of the AAV-infected M1 cortex slices stained with BODIPY493/503 10–11 days after AAV injection (f). Scale bar, 10 μm. Quantification of LD numbers of the cell bodies of M1 cortex slices (g). Mean ± s.d., n = 9 fields of view from n = 3 mice, ****P < 0.0001, two-tailed unpaired t-test. h,i, Lipidomic profiles of the AAV-infected M1 cortices show increased amounts of TG and DAG in neurons where spartin function was disrupted. Lipids were extracted from tissues and analysed by liquid chromatography–mass spectrometry (LC–MS) as described in Methods. Relative fold-changes are shown in (h). Triglyceride (TG); diacylglycerol (DAG); cholesterol ester (CE); ceramide (Cer); hexosylceramide (HexCer); sphingomyelin (SM); phosphatidylcholine (PC); ether-linked phosphatidylcholine (PC-O); phosphatidylethanolamine (PE); phosphatidylethanolamine plasmalogens (PE-P); ether-linked phosphatidylethanolamine (PE-O); phosphatidylinositol (PI); phosphatidylserine (PS); phosphatidic acid (PA); phosphatidylglycerol (PG); lysophosphatidylcholine (LPC); lysophosphatidylethanolamine (LPE); lysophosphatidylinositol (LPI); fatty acid (FA). LC–MS analysis verified widespread elevations in TGs from spartin-DN-expressing neurons of the M1 cortex (Spartin-DN), compared with a control (mSc-I) (i). Box-and-whisker plot, median ± the 25th to 75th percentiles, the whiskers extended to the minima and the maxima, n = 6 mice, **P < 0.01, ***P < 0.001 (h, TAG = 0.000506, DAG = 0.000081; i, 50:0 = 0.000782, 50:1 = 0.000688, 52:1 = 0.000452, 52:2 = 0.000516, 52:6 = 0.000860, 54:4 = 0.000849, 54:6 = 0.000463, 56:5 = 0.000738, 56:6 = 0.000444, 56:7 = 0.000393, 58:7 = 0.000754, 50:2 = 0.002913, 52:0 = 0.000684, 52:3 = 0.002428, 52:4 = 0.000621, 52:5 = 0.000911, 53:0 = 0.002413, 53:1 = 0.001690, 54:3 = 0.000166, 54:7 = 0.001090, 56:1 = 0.001576, 65:4 = 0.000350, 56:8 = 0.000765, 58:5 = 0.001099, 58:6 = 0.000570, 58:8 = 0.000339, 60:7 = 0.001566, 60:8 = 0.001432); two-tailed unpaired t-test in each row; multiple comparisons test using the two-stage step-up method of Benjamini, Krieger and Yekutieli. Source numerical data and unprocessed blots are available in source data.

