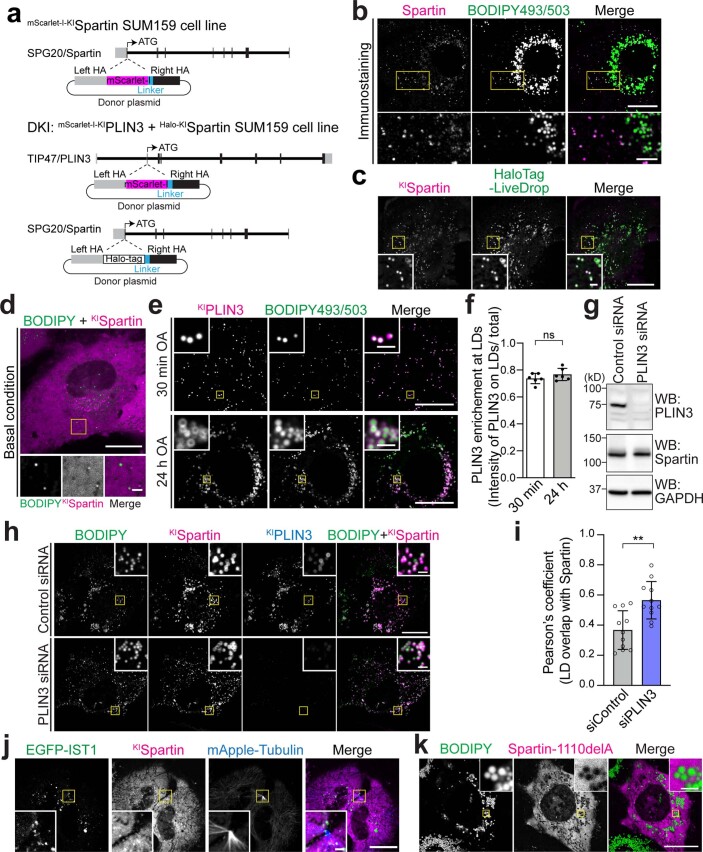
Extended Data Fig. 1. Endogenous spartin targets to LDs at the cell periphery.
a, Strategy for the endogenous tagging of SPG20/spartin and TIP47/PLIN3. Individual rectangular bar represents exon (gray color, untranslated region; black color, translated region). A donor plasmid was co-transfected with appropriate gRNA/Cas9 plasmid to induce homologous recombination of mScarlet-I or HaloTag into upstream of SPG20/spartin or TIP47/PLIN3. b, Confocal imaging of fixed SUM159 cells stained with endogenous spartin antibody and BODIPY493/503. Cells were treated with 0.5 mM OA for 24 h. Scale bars: full-size, 20 μm; insets, 2 μm. c,d, Confocal imaging of live SUM159 cells expressing endogenously fluorescent-tagged spartin (with mScarlet-I) at their gene locus. HaloTag–LiveDrop was transiently expressed and stained with 100 nM JF646 (c) and BODIPY493/503 (d). Cells were treated with 0.5 mM OA for 24 h (c). Scale bars: full-size, 20 μm; insets, 2 μm. e, Confocal imaging of live SUM159 cells expressing endogenously fluorescent-tagged spartin (HaloTag) and PLIN3 (mScarlet-I). Cells were pre-incubated with 0.5 mM OA for 30 min or 24 h prior to confocal live-cell microscopy. Scale bars: full-size, 20 μm; insets, 2 μm. f, Quantification of PLIN3 enrichment at LDs in PLIN3 and spartin double-KI SUM159 cells shown in (e). Mean ± SD, n = 6 fields of view from three independent experiments, n.s. not significant, two-tailed unpaired t-test. g, Immunoblot analyses of SUM159 PLIN3 (mScarlet-I) and spartin (HaloTag) double KI cells. Cells were treated with 20 nM negative control siRNA or PLIN3 siRNA for 72 h prior to lysate preparation. h, Confocal imaging of live SUM159 PLIN3 (mScarlet-I) and spartin (HaloTag) double KI cells. Cells were treated with 20 nM negative control siRNA or PLIN3 siRNA for 72 h prior to imaging. Cells were pre-incubated with 0.5 mM OA for 24 h and chased for 3 h after OA withdrawal, stained with JF646 (for HaloTag KI–spartin) and BODIPY493/503. Scale bars: full-size, 20 μm; insets, 2 μm. i, Quantification of spartin enrichment at LDs in PLIN3 and spartin double-KI SUM159 cells shown in (h). Mean ± SD, n = 11 cells from three independent experiments, **p = 0.0015, two-tailed unpaired t-test. j, Confocal imaging of live SUM159 cells expressing endogenously fluorescent-tagged spartin (with mScarlet-I) at their gene locus. EGFP–IST1 and mApple–Tubulin were transiently expressed. Scale bars: full-size, 20 μm; insets, 2 μm. k, Confocal imaging of live SUM159 spartin KO cells transiently expressing mScarlet-I–spartin-1110delA. Cells were treated with 0.5 mM OA for 24 h and stained with BODIPY493/503. Scale bars: full-size, 20 μm; insets, 2 μm. Source numerical data and unprocessed blots are available in source data.

