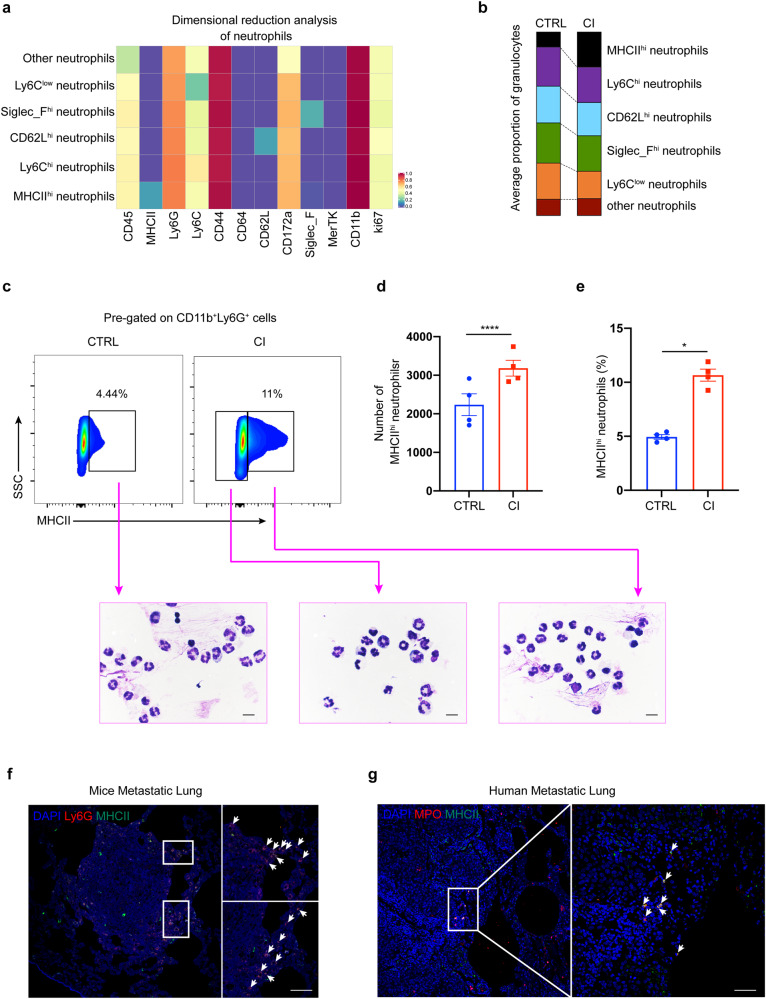
Fig. 3.
Identification of MHCIIhi neutrophils in the lung tissues of breast cancer-bearing mice. a Heatmap showing the differential expression of 12 neutrophil-related immune markers in the two groups. The immune subsets that represent these nodes based on their marker expression are noted. b The proportion of histogram showing the frequency of neutrophil subsets. c Flow cytometry-based detection (upper panel) of MHCIIhi or MHCIIlow neutrophils from the lung tissue of tumor-bearing mice with (lower right) or without chronic PAO1 infection (lower left). Plots are shown for gated live CD45+CD11b+Ly6G+ cells. Representative cytospin images (bottom) are from FACS (fluorescence-activated cell sorting)-sorted populations and Swiss-Giemsa staining. Scale bar, 10 μm. d, e Quantification (d) and frequency (e) of MHCIIhi neutrophils in (c), n = 4 mice/group. f Confocal immunofluorescent images of lung tissues from tumor-bearing mice with chronic PAO1 infection. Blue: DAPI; red: Ly6G; green: MHCII. Scale bar, 50 μm. g Confocal immunofluorescent images of lung tissues from patients with breast cancer. Blue: DAPI; red: MPO; green: MHCII. Scale bar, 50 μm. All data are presented as the mean ± SEM. Statistical significance was calculated using an unpaired t test. ****P < 0.0001; *P < 0.05

