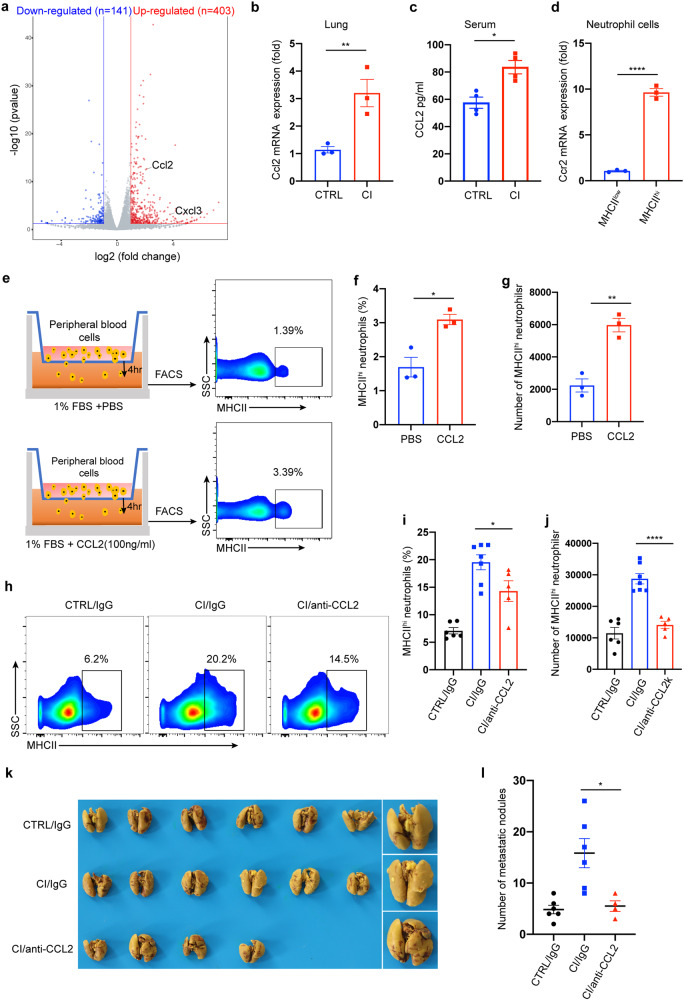
Fig. 6.
Chronical pulmonary infection-derived CCL2 recruits MHCIIhi neutrophils into the lung. a Volcano plot showing differential gene expression between lung tissue of tumor-free mice with or without chronic PAO1 infection. Genes with a false discovery rate (FDR) of <5% and an absolute fold change (FC) of >2 are highlighted in blue and red, denoting down- and upregulated genes, respectively, in the lung tissues from the two groups. n = 2 mice/group. b, c 4T1-bearing mice were treated with or without chronic PAO1 infection. Real-time PCR was performed on total RNA extracted from the lungs of mice to analyze Ccl2 gene expression (b), and the CCL2 protein levels from the serum of mice were measured by ELISA (c). d The levels of Ccr2 mRNA in MHCIIhi or MHCIIlow neutrophils in the lung were measured by real-time PCR. e–g Experimental design of the Transwell migration assay. All blood cells except erythrocytes derived from tumor-bearing mice were added to the top chamber (1 × 10⁶ cells), and the chemoattractant CCL2 (100 ng/ml) or control PBS was added to the bottom chamber (e). After incubation for 4 h, the cells harvested from the lower chamber were analyzed using flow cytometry. The proportion (f) and number (g) of MHCIIhi neutrophils. h–j Representative dot plots showing the exchange in the proportion of MHCIIhi neutrophils in the lung tissue of mice after neutralizing CCL2 (h). After the establishment of 4T1-bearing mouse models with or without chronic PAO1 infection, neutralizing antibody against CCL2 or isotype control (IgG) at 40 μg per mouse was instilled into the mouse via the trachea. The mice were sacrificed 2 days after the dose (day 18), and the proportion (i) and number (j) of MHCIIhi neutrophils in the lungs of mice were determined by FACS analysis. k, l Bright-field imaging of metastatic nodules in the lungs of tumor-bearing mice after neutralizing CCL2 (k). After the establishment of 4T1-bearing mouse models with or without chronic PAO1 infection, the CCL2-neutralizing antibody and isotype control at 40 μg per mouse were instilled into the lungs of mice on days 11, 14, and 17. On day 21, the mice were sacrificed, and the metastatic nodules in the lung were counted (i). n = 4–6 mice/group. All data are presented as the mean ± SEM. Statistical values were calculated using one-way ANOVA (b, c, d, f, g, l) or an unpaired t test (i, j). ns not significant; ****P < 0.0001; **P < 0.01; *P < 0.05

