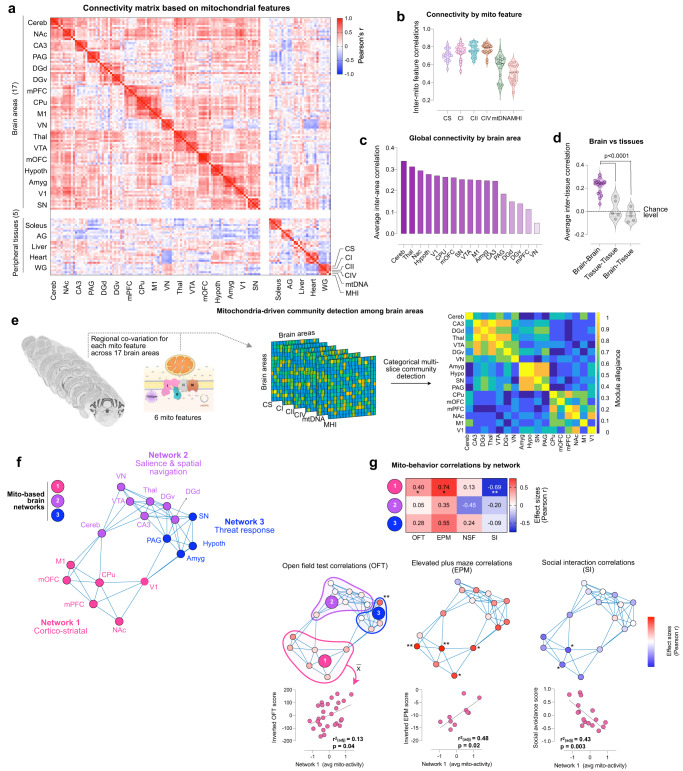
Fig. 3. Mitochondrial phenotype-based connectivity analysis across anatomical areas identifies large-scale brain networks that account for inter-individual variation in behaviors.
a Connectivity matrix of mitochondrial features across brain areas, using all 6 mitochondrial features across the animal cohort (n = 27 mice), quantified as Pearson’s r. The matrix is ordered by hierarchical clustering (Euclidian distance, Ward’s clustering). b Cross-correlation of each mitochondrial feature to the other 5 measures within each brain area (n = 17 brain areas). c Global connectivity based on the average correlation for each brain area with all other areas. d Average correlation of mitochondrial features between brain area’s, between peripheral tissues, and between brain areas and tissues; p < 0.0001, Ordinary one-way ANOVA with Tukey’s multiple comparisons. e Multi-slice community detection analysis on mitochondrial measures across the 17 brain areas (brain images acquired from the Allan Mouse Brain Atlas (Dong, H. W. The Allen reference atlas: A digital color brain atlas of the C57Bl/6 J male mouse. John Wiley & Sons Inc. (2008)), with mitochondrial features represented in six separate layers, resulting in f three distinct communities or brain networks. Modular structure confirmed by permutation test, p < 0.0001). g Average mito-behavior correlation by network for each behavioral test (top), with network 1 correlations p-values as follows: OFT: p = 0.039, EPM: p = 0.015, SI: p = 0.0033. The middle panel shows networks with each area color-coded by its average correlation with behaviors; for OFT (left), EPM (middle) and SI (right), *p < 0.05, **p < 0.01, two-tailed. The bottom panel shows scatterplots for network 1 correlations. The comparison of the modularity metrics with the modularity derived from whole-brain transcriptome and the structural connectome data, which show significant agreement, are shown in Supplementary Fig. 12. Source data are provided as a Source Data file.

