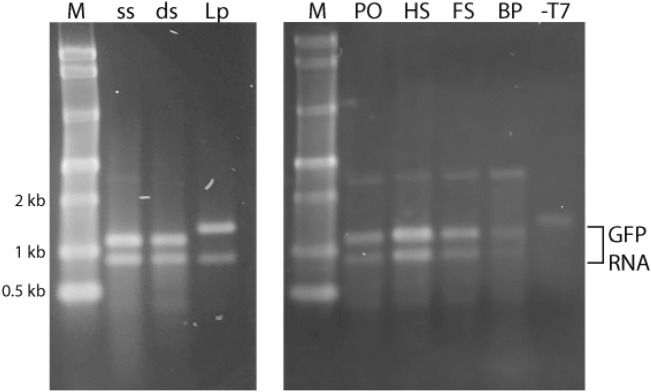
Figure 4.
In vitro transcription of DNA nanoparticles. Representative non-denaturing agarose gel electrophoresis results of in vitro transcription reactions. M: molecular marker; ss: ssT7EGFP; ds: dsT7GFP; Lp: LpCMV-T7-EGFP (linearized GFP plasmid); PO: T7GHL PO; HS: T7GHL HS; FS: T7GHL FS; BP: T7GHL BP; -T7: T7GHL-T7. LpCMV-T7-EGFP and dsT7EGFP were positive controls. ssT7EGFP, T7GHL BP, and T7GHL -T7 were putative negative controls. The bands at approximately 0.9 kb, 1.1 kb, and 1.3 kb represent GFP RNA. The 0.9 kb band represents transcripts that terminate at a T7 RNA polymerase termination/stall sequence, known to allow a significant amount of read-through32,33. The 1.1 kb and 1.3 kb RNA products represent read-through transcripts, the latter’s greater length resulting from the linearized plasmid being 200 bp longer than the PCR-generated linear duplex. The bands of approximately 2.5 kb for most of the samples and 1.5 kb in the T7GHL -T7 lane result from the presence of residual DNA templates.

