Figure 4.
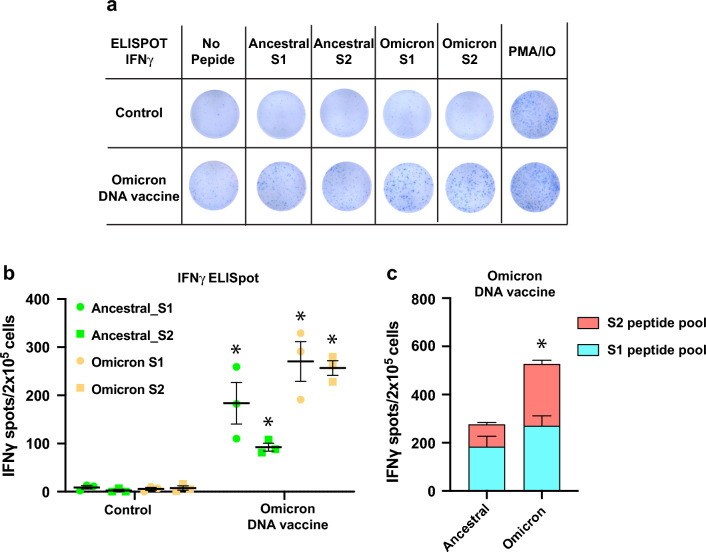
Cellular immune responses induced by SARS-CoV-2 Omicron DNA vaccine. (a) Representative image of ELISpot assay. Spike-specific T-cell responses were analyzed by ELISpot assay. At 7 weeks after the first dose of DNA vaccine, the vaccinated or control splenocytes were isolated and stimulated with spike peptide pool from ancestral as well as Omicron BA.1. (b) Quantitative analysis of IFNγ-releasing cells from ELISpot assay. The number of spots were analyzed after subtraction from background spots (no peptide stimulation) of each group. *p < 0.05 versus control (c) Quantitative data of the total number of spots (S1 + S2) of IFNγ-releasing cells from each strain (S1 and S2 peptide pool). *p < 0.05 versus ancestral spike. N = 3. The experiments were repeated twice. Data are presented as mean ± SEM.

