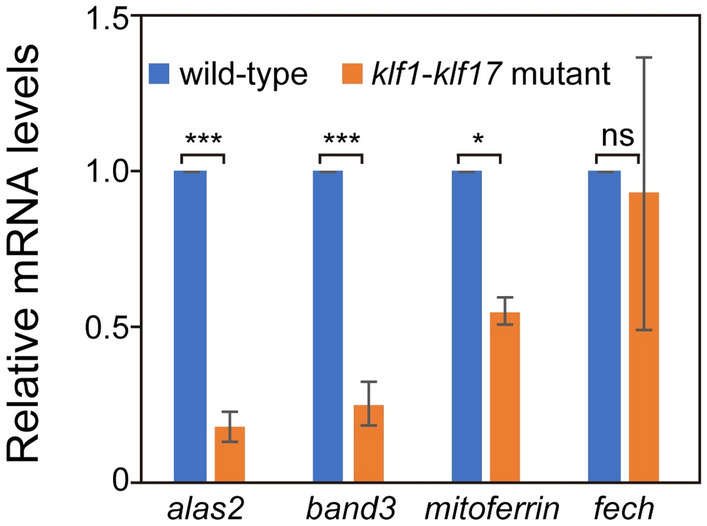
Figure 6.

Expression levels of haematopoietic genes in the klf1-klf17 mutant. Quantitative real-time PCR (qPCR) represents the indicated gene expression relative to that of the tubulin α1 (tuba1) gene. alas2, *** p < 0.001. band3, *** p < 0.001. mitoferrin, * p < 0.05. fech, ns, not significant. The results are expressed as the mean ± standard deviation (SD). The fech expression level was comparable between the wild-type and the klf1-klf17 mutant, whereas the expression levels of alas2, band3 and mitoferrin were diminished in the klf1-klf17 mutant.
