Fig. 1.
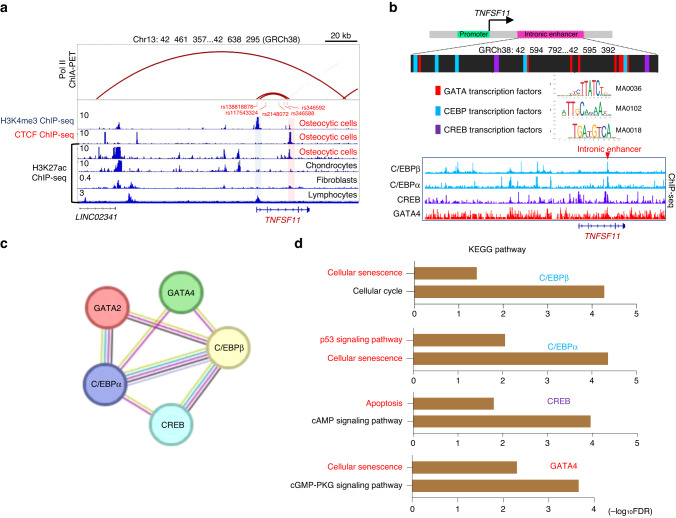
Identification of an intronic enhancer within the TNFSF11 gene locus in osteocytic cells. a H3K4me3, CTCF and H3K27ac ChIP-seq profiles in human osteocytic cells (GSE188004, GSE175159, GSE187956),22 chondrocytes (GSE188124),22 fibroblasts (GSE128642),56 and lymphocytes (ENCFF021TWR) and RNA Pol II ChIA–PET results (ENCFF674MPM) in WTC11 cells within the TNFSF11 gene locus. The blue and red shaded areas indicate the RANKL promoter region and intronic enhancer region, respectively. Genetic variants associated with bone mineral density (P < 5 × 10⁻⁶) identified in previous studies25–28 that are located in the RANKL promoter-intronic enhancer loop are indicated in red letters. b Schematic depicting the enriched transcription factor-binding motifs and the predicted binding sites within the intronic enhancer region (upper). ChIP-seq profiles of C/EBPβ (ENCFF679XUJ), C/EBPα (ENCFF988QGQ), CREB1 (ENCFF894ALC) and GATA4 (ENCFF213XUO) (lower). c,d Protein‒protein interaction network (c) and functional enrichment analysis (d) of the predicted TFs using the STRING database58 (https://string-db.org)

