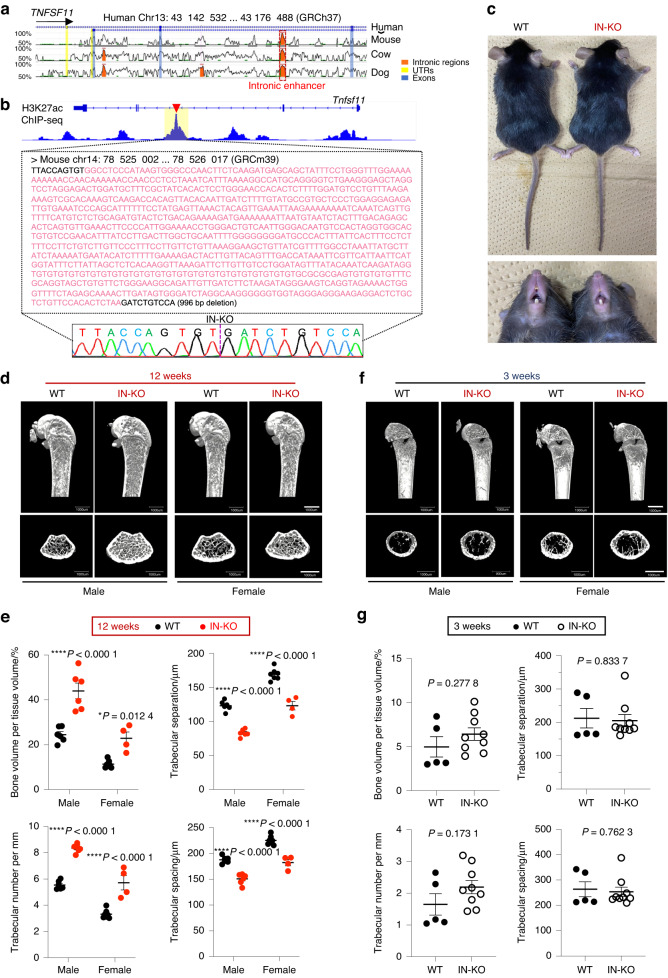
Fig. 3.
Deletion of the intronic enhancer leads to an age-dependent high-bone-mass phenotype. a Sequence similarity analysis of the intronic enhancer among human, mouse, cow and dog genomes using the ECR Browser59 (https://ecrbrowser.dcode.org) with 90% ECR similarity across a 300-base-pair ECR length. b H3K27ac ChIP-seq profile in murine osteocytic cells (GSE54784).36 The nucleic acid sequence of the intronic enhancer in mice is shown in the lower panel. The sequence region colored pink denotes the deletion region obtained with the CRISPR/Cas9 method. c Representative macroscopic images of more than three wild-type (WT) and intronic enhancer-knockout (IN-KO) mice (female, 12 weeks). d, e Representative micro-CT images (d) and micro-CT parameters (e) of the femur in WT and IN-KO mice at the age of 12 weeks (n = 6 male WT and n = 6 male IN-KO mice; n = 7 female WT and n = 4 female IN-KO mice). f, g Representative micro-CT images (f) and micro-CT parameters (g) of the femur in WT and IN-KO mice at the age of 3 weeks (n = 5 female WT and n = 9 female IN-KO mice). Micro-CT scale bars: 1 mm. The data are expressed as the mean ± SEM. P values were determined by two-way ANOVA followed by Tukey’s post hoc test (e) and two-tailed t test (g)

