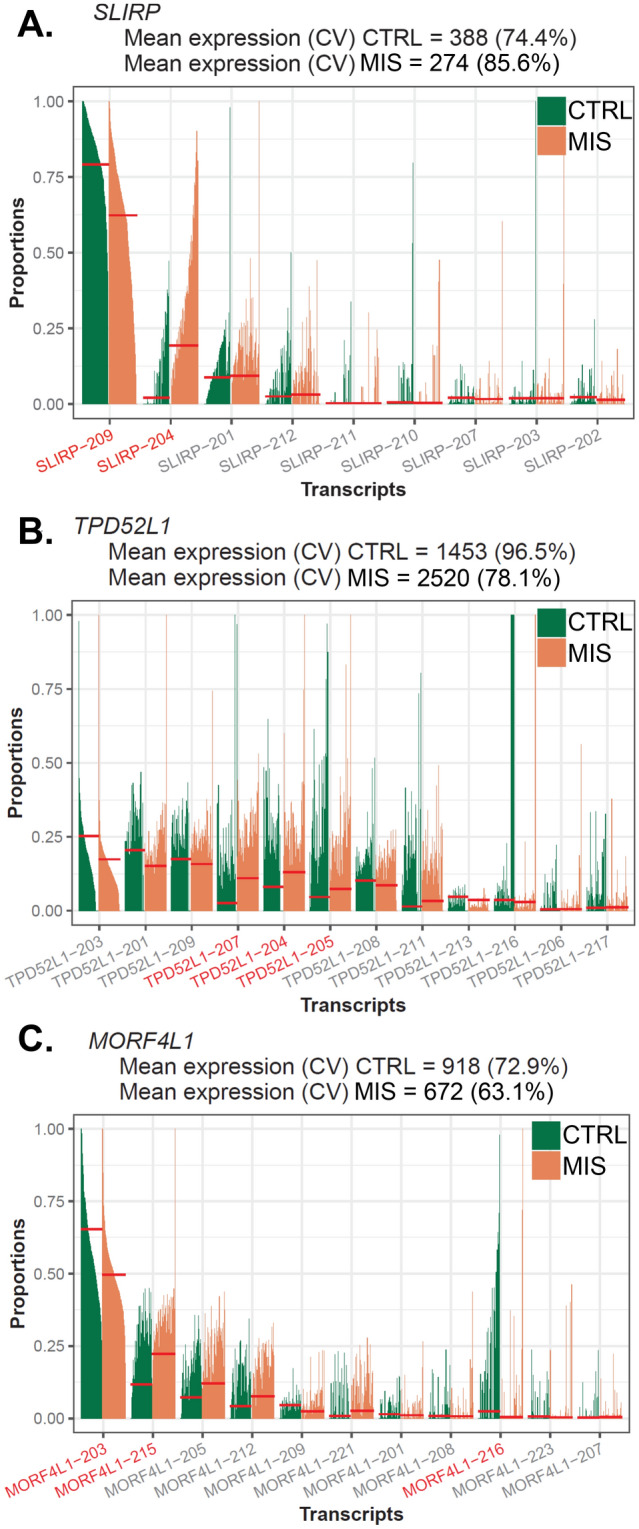
Figure 5.

Top 3 significant DTU genes in the comparison of MIS LBSL cells versus control cells. Bar plots of proportions of each transcript per cell (mean proportion fit: short red line). Significant DTU transcripts are represented as red fonts. (A) The expression of SLIRP was downregulated in MIS cells, and DTU analysis revealed the switching from protein-coding to nonsense mediated decayed transcripts, indicating that dysregulated splicing may have led to the decreased gene expression. (B) DTU analysis further elucidated that LBSL cells not only had higher transcript usage of protein coding transcripts of TPD52L1, (TPD52L1-204 and TPD52L1-207) but also of intron-retaining transcripts (TPD52L1-205). (C) Finally, DTU analysis indicated MORF4L1 switching from transcripts with long 3' untranslated region (UTR) to transcripts with short 3’ UTR.
