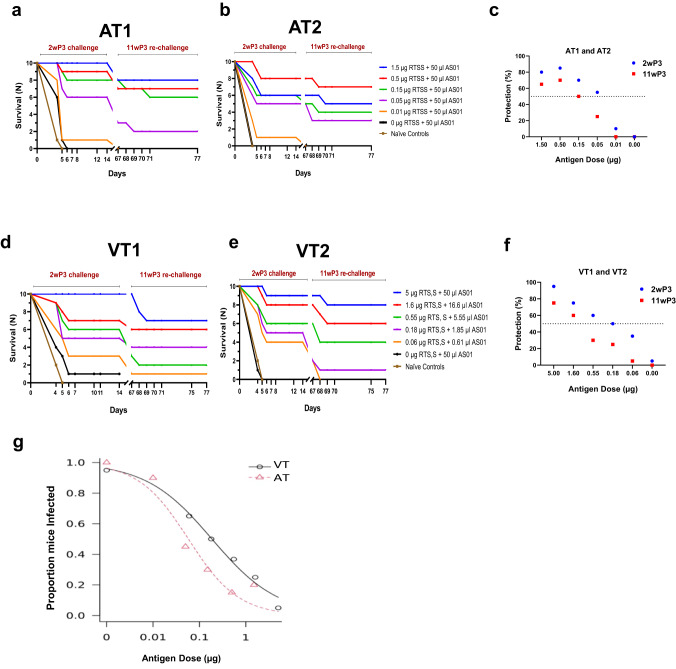
Fig. 2. Efficacy data for antigen titration (AT) and vaccine titration (VT).
Survival curves 2 weeks post-3rd vaccine challenge and 11 weeks post-3rd vaccine re-challenge for the (a) AT1, (b) AT2, (d) VT1, and (e) VT2 experiments. All naïve controls for the re-challenge were infected by day 5 (not plotted). c, f Mean percent sterile protection for 2 weeks post-3rd vaccine and 11 weeks post-3rd vaccine challenge (2wP3, 11wP3) for AT and VT experiments, respectively (n = 20 per group). The dotted black line denotes 50% protection. g Estimation of PD50 using a two parameter log logistic model. The fitted dose-response curves for AT and VT are shown.

