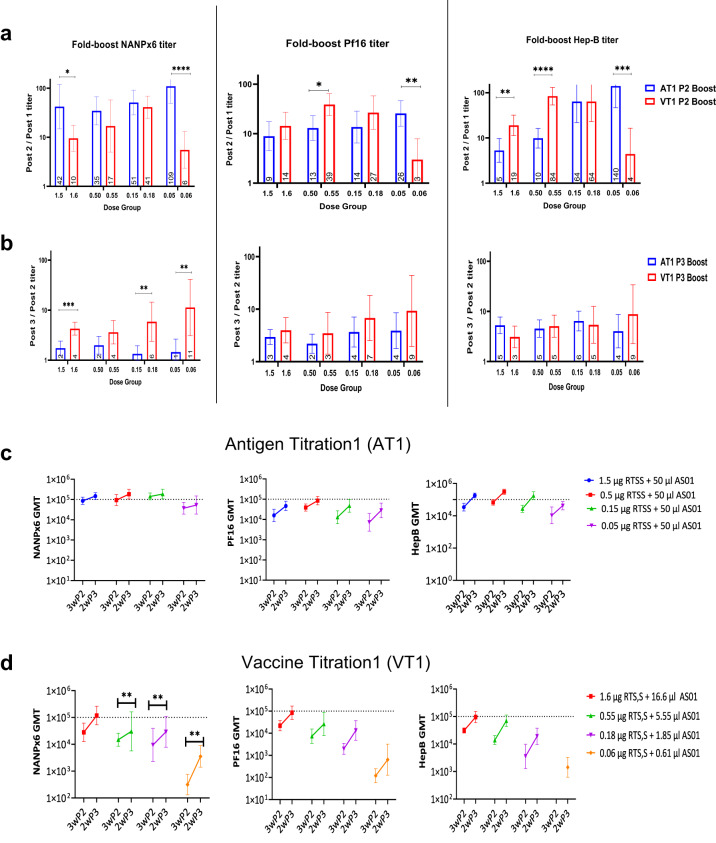
Fig. 4. Boosting patterns for AT1 vs. VT1.
Fold GMT boost in antibody titers for AT1 and VT1 experiments observed after (a) the 2nd vaccination (ratio of post-2nd/post-1st vaccine titer) or (b) the 3rd vaccination (ratio of post-3rd/post-2nd titer). Magnitude of antibody titers at 3 weeks post-2nd and 2 weeks post-3rd vaccine for (c) AT1 and (d) VT1 against NANPx6, Pf16, and HepB antigens. Dotted lines represent saturating OD415 = 1 titer of 105. Significant P values for Mann–Whitey U tests are indicated. * P < 0.05; ** <0.01; ***<0.001; ****<0.0001). Error bars represent geometric mean and 95% CI.

