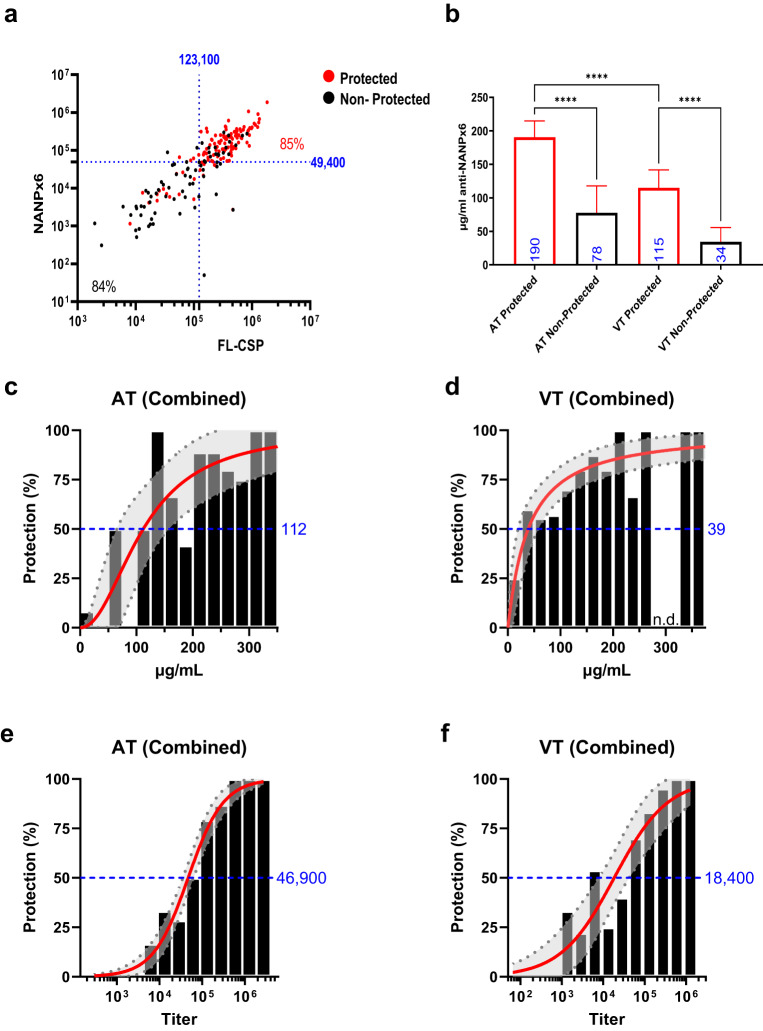
Fig. 6. Models of vaccine protective efficacy.
a NANPx6 vs. FL-CSP titers for combined AT and VT studies (n = 280) and optimal protection titer cutoffs predicted by AUC analysis are shown as dotted lines. The percentage of protected (red) or non-protected (black) mice are shown in high and low titer quadrants. b Geometric mean (±95% CI) anti-NANPx6 antibody concentration (µg/ml) determined by BLI for protected and non-protected AT and VT experiment mice; ****ANOVA P value < 0.0001. c, d Modeling of antibody protective efficacy using Hill equation for µg/ml concentrations or (e, f) NANPx6 ELISA titer following challenge. Histogram shows the distribution of antibody concentrations. The shaded regions represent the 95% CI for estimated vaccine efficacy. Antibody amounts predicted for 50% efficacy are shown in blue.

