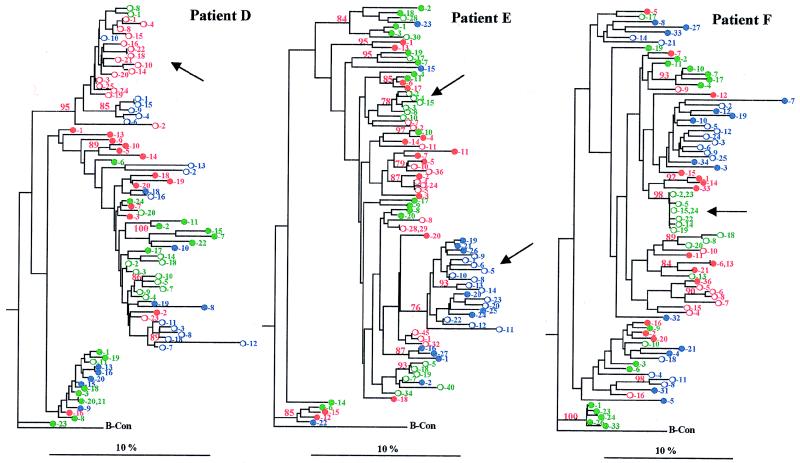
FIG. 2.
Phylogenetic reconstruction of the evolutionary relationships within the six subjects. The deduced amino acid sequence of all proviral and cell-free genomic RNA clones were analyzed along with the B-clade consensus as the outgroup by using the Kimura’s formula distance matrix fed into the neighbor-joining tree construction algorithm. Bootstrap proportions greater than 75 of 100 bootstrap replicates are shown in the appropriate branch point. Branch lengths are drawn to scale. Sequences from TPs (patients A to C) are less divergent than those from SPs (patients D to F), as demonstrated by the scale bar. Specific clusters of viral variants in SPs, which are characteristic of RNA clones, are indicated by arrows. A major cluster of viral variants in patient B (arrow) is characterized by major amino acid changes in the V3 loop. The different samples are indicated in color: green (first), red (second), and blue (third). The clone number is reported close to the symbols. The plasma-derived sequences (○) and provirus-derived sequences (●) are indicated.


