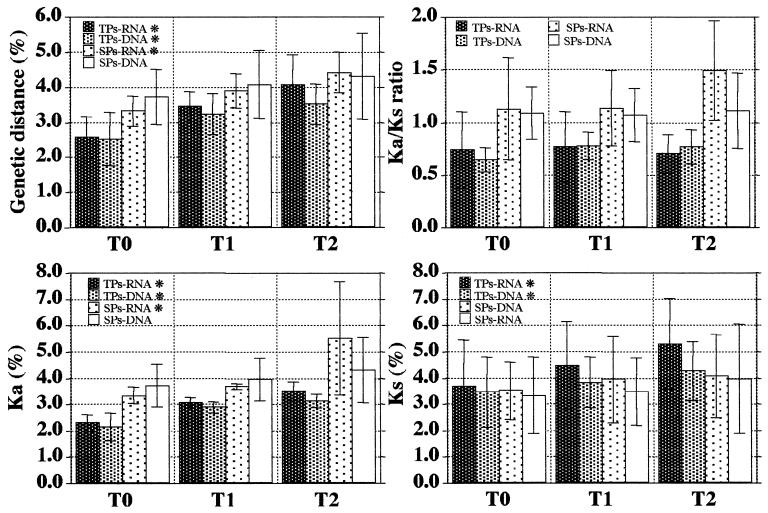
FIG. 3.
Dynamics of HIV-1 evolutionary parameters in TP and SP subjects. Bars represent the mean values ± the standard deviations of the genetic distance, antonymous (Ka) and synonymous (Ks) substitutions, and Ka/Ks ratio (see Table 3) relative to subjects grouped for the clinical status (TPs and SPs) and nucleic acid sequenced (RNA and DNA) at the three time points (T0, T1, and T2). Asterisks close to the group’s symbol indicate that the rate of increase over time reaches the significant level of 5% for that group (Friedman test).

