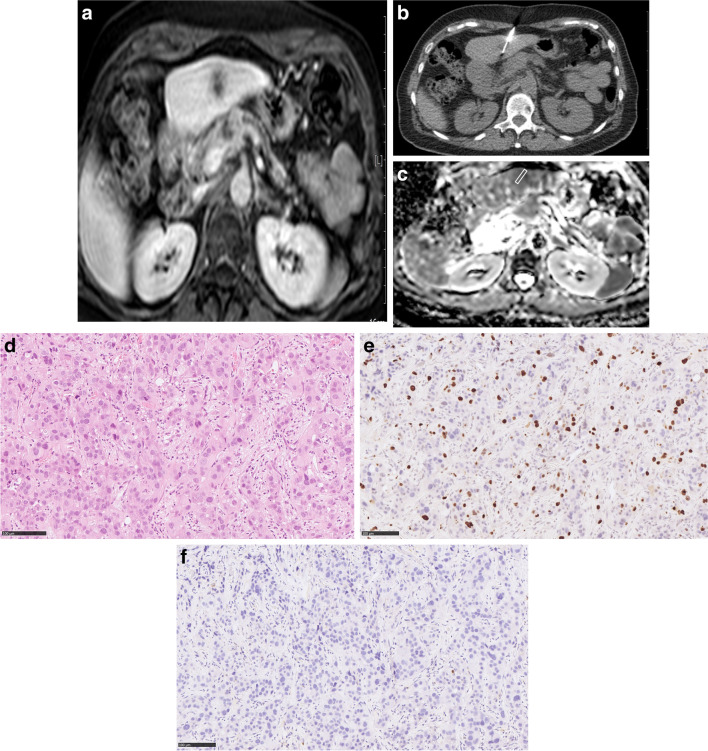
Fig. 6.
Relationships between ADC and histopathological features in pancreatic cancer liver metastases. a Target lesion on T1w image (venous phase). b Documentation of needle position within the target lesion on CT-guided biopsy image. c ADC image of the target lesion with the cylindrical region of interest according to the needle position on CT biopsy images. The estimated mean ADC value is 1.05 × 10⁻³ mm2/s. d H&E-stained image. Cell count is 113. TSR is 5.5%. e MIB-stained image. Ki 67 index is 20%. f CD 45 stained image. The mean number of CD 45 positive cells is 1.5

