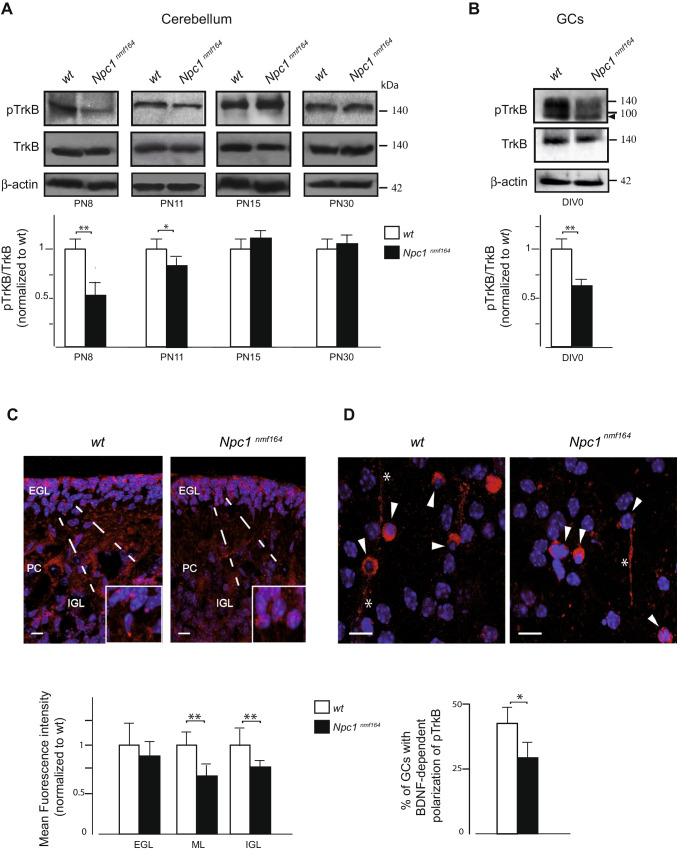
Fig. 3.
Abnormal pTrkB receptor expression and localization are observed in the early stage of cerebellar development and in vitro GCs of Npc1nmf164 mice. A, B Representative immunoblots of pTrkB protein expression in extracts from wt and Npc1nmf164 mice at different stages of cerebellar development (PN8,11, 15, and 30) and in DIV0 GCs. Western blot quantification of pTrkB in wt (white bars) and Npc1nmf164 (black bars) mice. Histograms indicate the abundance (mean ± SD) of each protein determined by the densitometry of protein bands obtained by taking total TrkB (TrkB) as an internal reference. Arrowhead indicates TrkB truncated form present in GCs. Significance is shown as a p value calculated using an unpaired t test. *p < .05 versus wt. **p < .01 versus wt (n = 5 mice/group). C, D Representative fields of confocal images are shown in the figure. Detection of pTrkB receptor (red) and nuclei (Hoechst 33258, blue) in PN8 cerebellar sections and in DIV3 GCs. The GCs in the EGL are magnified in the boxed regions of panel C. Scale bar: 20 μm. Comparison of the mean fluorescence intensity (y-axis) generated by staining sagittal sections of PN8 cerebellar cortex layers of wt and Npc1nmf164 mice with antibodies against pTrkB receptor. D GCs expressing pTrkB receptors in the soma (arrowheads) and in the leading process (asterisks) are indicated. Data shown represent the means ± SD and were evaluated by unpaired t test. **p < .01 versus wt (n = 3 mice/group). ML, molecular layer; PC, Purkinje cell; IGL, internal granular layer. Quantitative analysis of in vitro GCs with BDNF-dependent pTrkB polarization in wt and Npc1 mutant mice is shown as a p value calculated using an unpaired t test. *p < .05 versus wt

