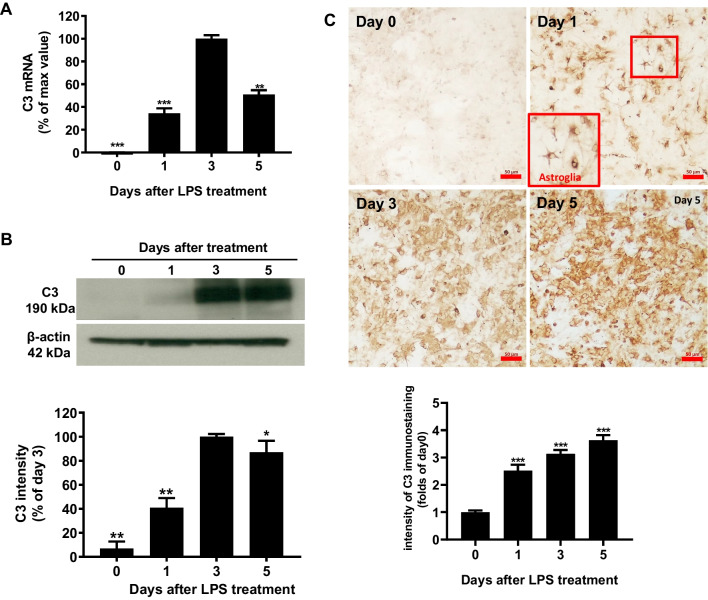
Fig. 1.
Mouse primary midbrain neuron/glial cultures were treated with LPS (15 ng/ml), and expression of C3 was detected at different time points after treatment (1, 3, 5 days). A C3 mRNA levels were detected by real-time PCR analysis. B Western blot analysis was quantified by densitometry. C Immunostaining pictures were performed with an antibody against C3, and quantitative values were obtained with Image J. Scale bar: 50 μm. Values are expressed as mean ± SEM from at least three independent experiments in duplicate. *p < 0.05, **p < 0.01, ***p < 0.001. Data were analyzed with one-way ANOVA followed by Dunnett’s post hoc multiple comparisons test

