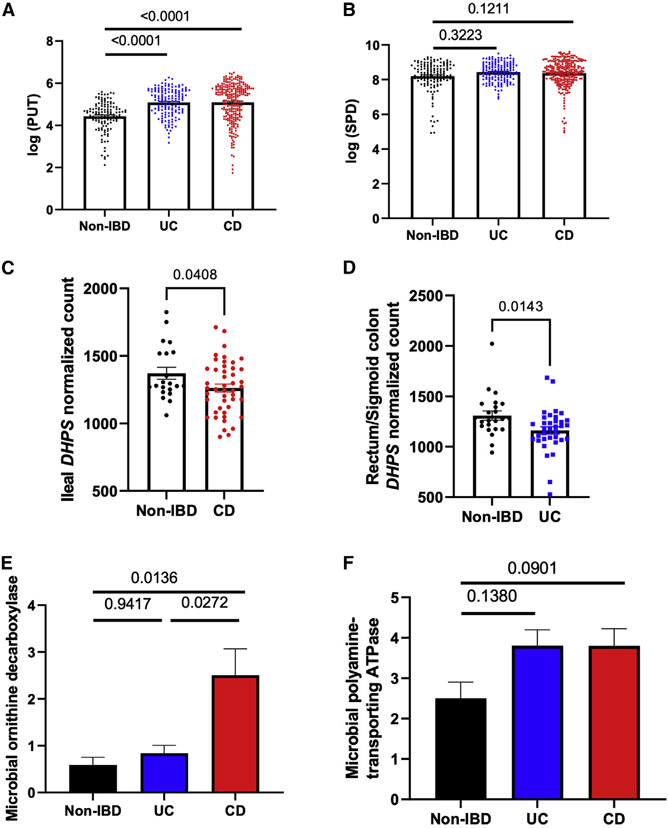
Figure 6. Polyamine in patients with IBD.
(A and B) Fecal PUT (A) and SPD (B) concentration of patients with non-IBD (n = 127), UC (n = 146), and CD (n = 261) from iHMP cohort measured by liquid chromatography-mass spectrometry (LC-MS) methods.
(C and D) Ileal (n = 21 in non-IBD and n = 46 in CD) (C) and rectum/sigmoid colon (D) (n = 23 in non-IBD and n = 35 in UC) DHPS normalized counts measured by RNA sequencing (RNA-seq).
(E and F) Gut microbial genetic transcripts of (E) ornithine decarboxylase and (F) polyamine-transporting ATPase from patients with non-IBD (n = 199), UC (n = 232), and CD (n = 382) in iHMP cohort measured by whole metatranscriptome sequencing.
Statistical testing was performed using the Kruskal-Wallis test and Dunn’s multiple comparison test. Data are represented as mean ± SEM.

